File:Darbouxplot.png
From specialfunctionswiki
Size of this preview: 600 × 599 pixels. Other resolutions: 240 × 240 pixels | 886 × 885 pixels.
Original file (886 × 885 pixels, file size: 70 KB, MIME type: image/png)
#!/usr/bin/python
import numpy as np
import matplotlib.pyplot as plt
from mpmath import *
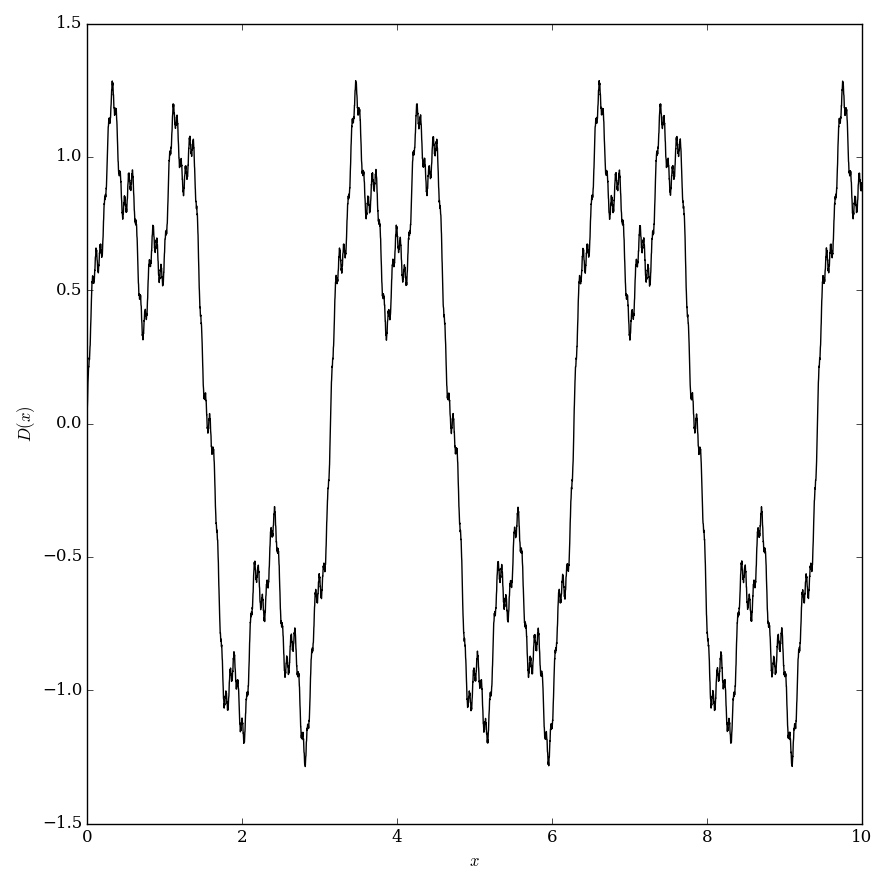
def darboux(x):
return nsum(lambda k: sin(fac(k+1)*x)/fac(k),[1,inf])
x=np.arange(0,5,0.0001);
f=np.vectorize(darboux)
y=f(x)
plt.xlabel('x')
plt.ylabel('Darboux(x)')
plt.plot(x,y,linewidth=0.5)
plt.show()
File history
Click on a date/time to view the file as it appeared at that time.
| Date/Time | Thumbnail | Dimensions | User | Comment | |
|---|---|---|---|---|---|
| current | 20:48, 5 July 2016 | | 886 × 885 (70 KB) | Tom (talk | contribs) | Category:Plot <pre>#!/usr/bin/python import numpy as np import matplotlib.pyplot as plt from mpmath import * from pylab import rcParams rcParams['figure.figsize'] = 10, 10 def darboux(x): return nsum(lambda k: sin(fac(k+1)*x)/fac(k),[1,inf... |
| 18:24, 21 January 2016 | 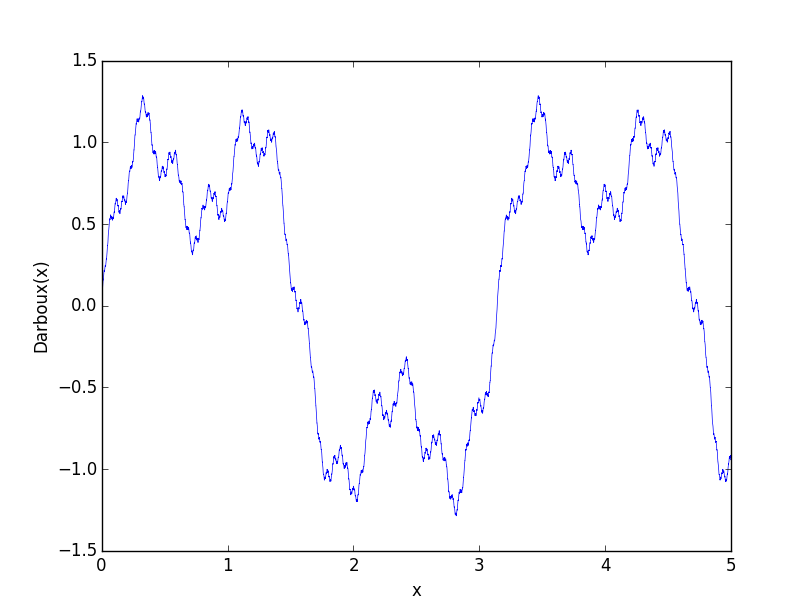 | 812 × 612 (35 KB) | Tom (talk | contribs) | #!/usr/bin/python import numpy as np import matplotlib.pyplot as plt from mpmath import * def darboux(x): return nsum(lambda k: sin(fac(k+1)*x)/fac(k),[1,inf]) x=np.arange(0,5,0.0001); f=np.vectorize(darboux) y=f(x) plt.xlabel('x') plt.ylabel... |
- You cannot overwrite this file.
File usage
The following page links to this file: