File:Mertensplot,n=0to2000.png
From specialfunctionswiki
Size of this preview: 604 × 600 pixels. Other resolutions: 242 × 240 pixels | 891 × 885 pixels.
Original file (891 × 885 pixels, file size: 43 KB, MIME type: image/png)
#!/usr/bin/python
import numpy as np
import matplotlib.pyplot as plt
from mpmath import *
from pylab import rcParams
rcParams['figure.figsize'] = 10, 10
def numberOfFactors(n):
counter = 0
while (n > 1):
i=2
while (i <= n):
if(n%i ==0):
n /= i
counter += 1
break
i += 1
return counter
def isDivisibleBySquare(n):
i=2
while(i**2 <= n):
if (n%(i**2)==0):
return 1
i += 1
return 0
def isValid(n):
if (n <= 0):
return 0
elif (n-int(n) != 0):
return 0
return 1
def mobius(n):
if not isValid(n):
return 0
elif (n==1):
return 1
elif(isDivisibleBySquare(n)):
return 0
else:
return (-1)**numberOfFactors(n)
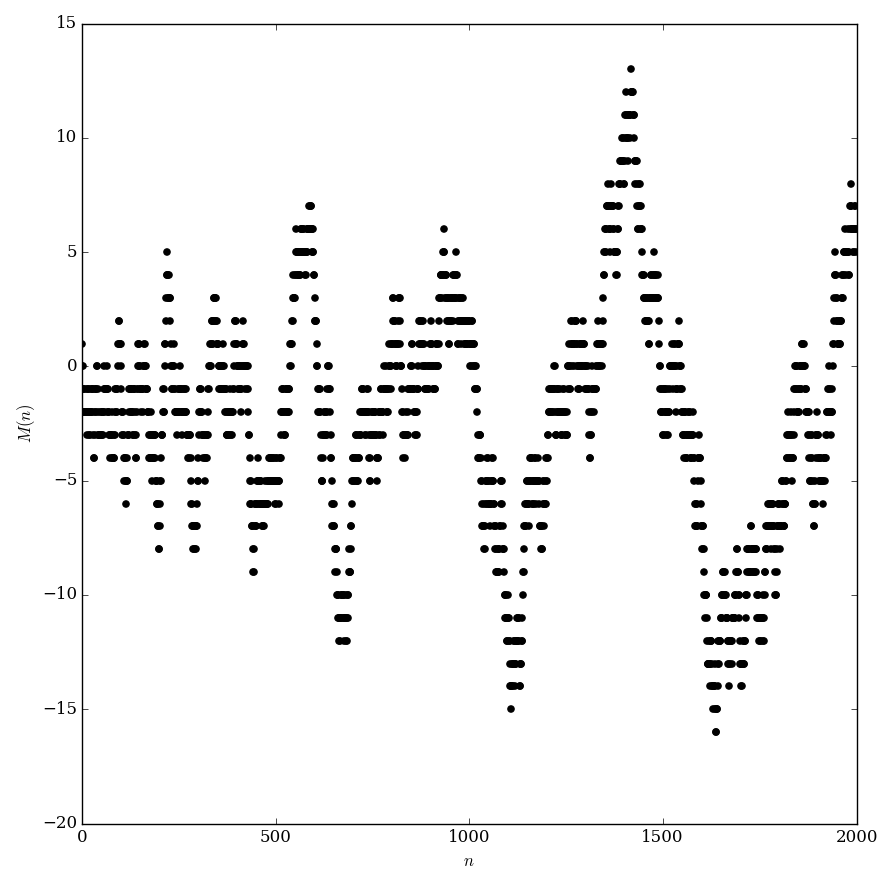
def mertens(n):
return nsum(lambda x: mobius(x), [1,n])
fig, ax = plt.subplots()
x=np.arange(0,2000,1)
f=np.vectorize(mertens)
y=f(x)
plt.xlabel(r'$n$')
plt.ylabel(r'$M(n)$')
#xlabels=[item.get_text() for item in ax.get_xticklabels()]
#xlabels=[r'$0$',r'$20$',r'$40$',r'$60$',r'$80$',r'$100$']
#ax.set_xticks([0,20,40,60,80,100])
#ax.set_xticklabels(xlabels,horizontalalignment='center')
#ylabels=[item.get_text() for item in ax.get_yticklabels()]
#ylabels=[r'$-1$',r'$0$',r'$1$']
#ax.set_yticks([-1,0,1])
#ax.set_yticklabels(ylabels,verticalalignment='center')
plt.xlim(0,2000)
plt.scatter(x,y,color='Black')
plt.savefig('mertensplot,n=0to2000.png',bbox_inches='tight',pad_inches=0.15)
File history
Click on a date/time to view the file as it appeared at that time.
| Date/Time | Thumbnail | Dimensions | User | Comment | |
|---|---|---|---|---|---|
| current | 23:25, 16 June 2016 | | 891 × 885 (43 KB) | Tom (talk | contribs) | Category:Plot <pre>#!/usr/bin/python import numpy as np import matplotlib.pyplot as plt from mpmath import * from pylab import rcParams rcParams['figure.figsize'] = 10, 10 def numberOfFactors(n): counter = 0 while (n > 1):... |
- You cannot overwrite this file.
File usage
The following page links to this file: