File:Primecountingplot.png
From specialfunctionswiki
Size of this preview: 581 × 600 pixels. Other resolutions: 232 × 240 pixels | 857 × 885 pixels.
Original file (857 × 885 pixels, file size: 20 KB, MIME type: image/png)
#!/usr/bin/python
import numpy as np
import matplotlib.pyplot as plt
from mpmath import *
from pylab import rcParams
rcParams['figure.figsize'] = 10, 10
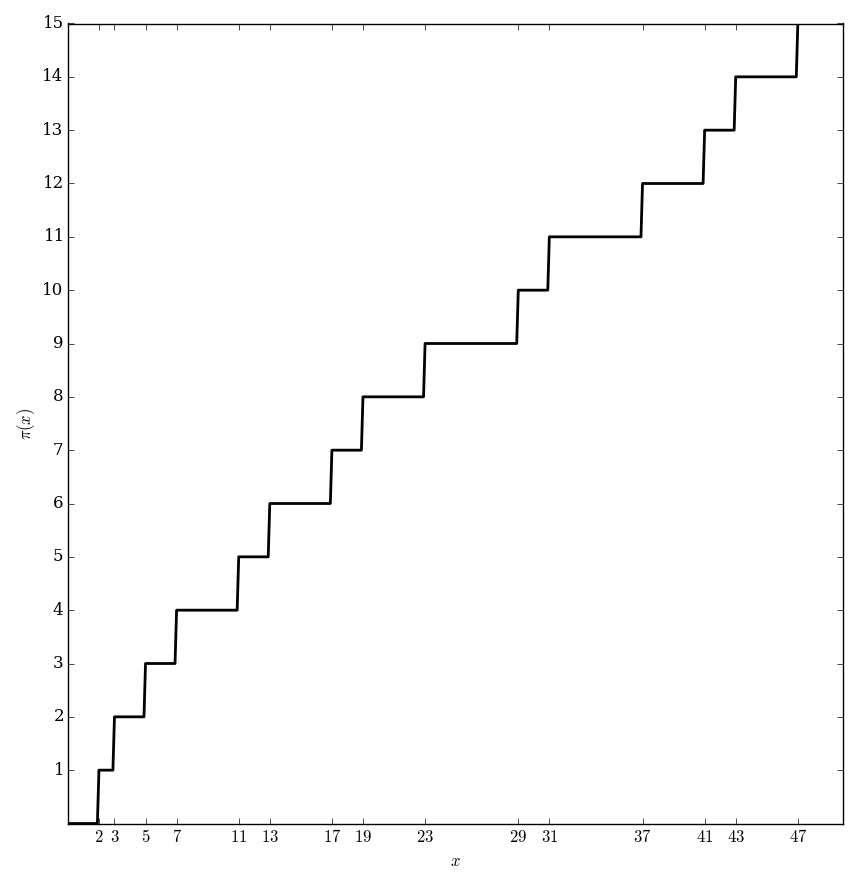
x=np.arange(0,50,0.1);
f=np.vectorize(primepi)
y=f(x)
fig, ax = plt.subplots()
xlabels = [item.get_text() for item in ax.get_xticklabels()]
xlabels=[r'$2$',r'$3$',r'$5$',r'$7$',r'$11$',r'$13$',r'$17$',r'$19$',r'$23$',r'$29$',r'$31$',r'$37$',r'$41$',r'$43$',r'$47$']
ax.set_xticks([2,3,5,7,11,13,17,19,23,29,31,37,41,43,47])
ax.set_xticklabels(xlabels,horizontalalignment='center')
plt.xlabel('$x$')
plt.ylabel('$\mathrm{\pi}(x)$')
ylabels=[1,2,3,4,5,6,7,8,9,10,11,12,13,14,15,16]
ax.set_yticks([1,2,3,4,5,6,7,8,9,10,11,12,13,14,15,16])
ax.set_yticklabels(ylabels,verticalalignment='center')
plt.plot(x,y,linewidth=2,color='Black')
plt.savefig('primecountingplot.png',bbox_inches='tight',pad_inches=0.15)
File history
Click on a date/time to view the file as it appeared at that time.
| Date/Time | Thumbnail | Dimensions | User | Comment | |
|---|---|---|---|---|---|
| current | 20:03, 16 May 2016 | | 857 × 885 (20 KB) | Tom (talk | contribs) | Category:Plot <pre>#!/usr/bin/python import numpy as np import matplotlib.pyplot as plt from mpmath import * from pylab import rcParams rcParams['figure.figsize'] = 10, 10 x=np.arange(0,50,0.1); f=np.vectorize(primepi) y=f(x) fig, ax = plt.subplo... |
- You cannot overwrite this file.
File usage
The following page links to this file: