File:Primezetaplot.png
From specialfunctionswiki
Size of this preview: 589 × 600 pixels. Other resolutions: 236 × 240 pixels | 860 × 876 pixels.
Original file (860 × 876 pixels, file size: 25 KB, MIME type: image/png)
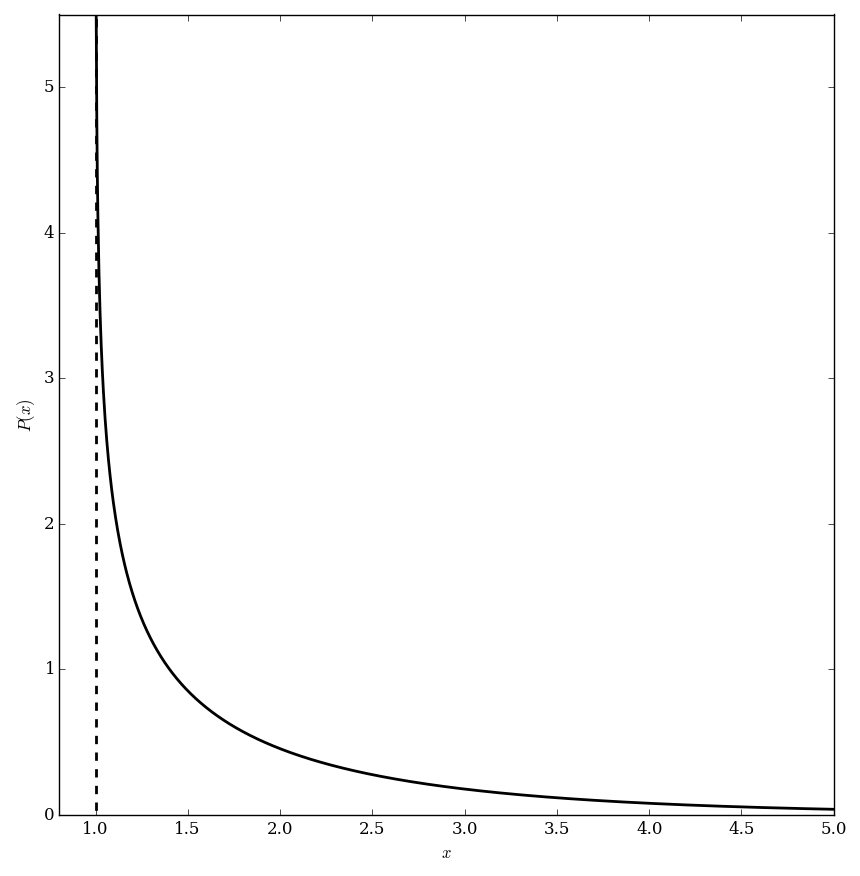
#!/usr/bin/python
import numpy as np
import matplotlib.pyplot as plt
from mpmath import *
from pylab import rcParams
rcParams['figure.figsize'] = 10, 10

x=np.arange(1,5,0.003);
x2=np.arange(-1,6,0.1);
f=np.vectorize(primezeta)
y=f(x)
def g(x):
        return 1
h=np.vectorize(g)
y2=h(x2)

fig, ax = plt.subplots()

plt.xlabel(r'$x$')
plt.ylabel(r'$P(x)$')

plt.plot(x,y,linewidth=2,color='Black')
plt.plot(y2,x2,'--',linewidth=2,color='Black')

plt.xlim([0.8,5])
plt.ylim([0,5.5])

plt.savefig('primezetaplot.png',bbox_inches='tight',pad_inches=0.15
File history
Click on a date/time to view the file as it appeared at that time.
| Date/Time | Thumbnail | Dimensions | User | Comment | |
|---|---|---|---|---|---|
| current | 18:20, 24 May 2016 | | 860 × 876 (25 KB) | Tom (talk | contribs) | Category:Plot <pre>#!/usr/bin/python import numpy as np import matplotlib.pyplot as plt from mpmath import * from pylab import rcParams rcParams['figure.figsize'] = 10, 10 x=np.arange(1,5,0.003); x2=np.arange(-1,6,0.1); f=np.vectorize(primezeta) y... |
- You cannot overwrite this file.
File usage
The following page links to this file: