File:Complexsiplot.png
From specialfunctionswiki
Revision as of 21:36, 23 May 2016 by Tom (talk | contribs) (Category:DomainColoring <pre>#!/usr/bin/python import numpy as np import matplotlib.pyplot as plt from mpmath import * cplot(si,[-15,15],[-15,15],points=50000,verbose=True) plt.title(r'Domain coloring of $\mathrm{Si}(z)$.') plt.savefig('complexsip...)
No higher resolution available.
Complexsiplot.png (570 × 571 pixels, file size: 138 KB, MIME type: image/png)
#!/usr/bin/python
import numpy as np
import matplotlib.pyplot as plt
from mpmath import *
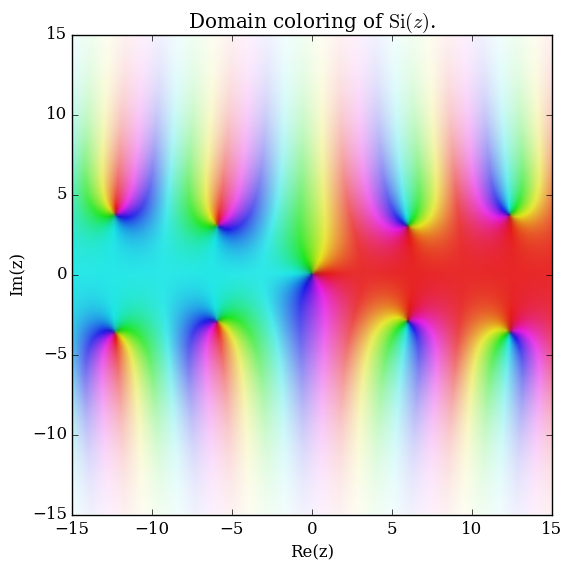
cplot(si,[-15,15],[-15,15],points=50000,verbose=True)
plt.title(r'Domain coloring of $\mathrm{Si}(z)$.')
plt.savefig('complexsiplot.png',bbox_inches='tight',pad_inches=0.1)
File history
Click on a date/time to view the file as it appeared at that time.
| Date/Time | Thumbnail | Dimensions | User | Comment | |
|---|---|---|---|---|---|
| current | 21:36, 23 May 2016 | | 570 × 571 (138 KB) | Tom (talk | contribs) | Category:DomainColoring <pre>#!/usr/bin/python import numpy as np import matplotlib.pyplot as plt from mpmath import * cplot(si,[-15,15],[-15,15],points=50000,verbose=True) plt.title(r'Domain coloring of $\mathrm{Si}(z)$.') plt.savefig('complexsip... |
- You cannot overwrite this file.
File usage
The following page links to this file: