Difference between revisions of "File:Struveh0plot.png"
From specialfunctionswiki
(#!/usr/bin/python import numpy as np import matplotlib.pyplot as plt from mpmath import * from pylab import rcParams import scipy.special rcParams['figure.figsize'] = 10, 10 x=np.arange(-30,30,0.001); f=np.vectorize(lambda x: scipy.special.struve(0,x)...) |
|||
| Line 1: | Line 1: | ||
| − | #!/usr/bin/python | + | <pre>#!/usr/bin/python |
import numpy as np | import numpy as np | ||
import matplotlib.pyplot as plt | import matplotlib.pyplot as plt | ||
| Line 21: | Line 21: | ||
plt.plot(x,y,linewidth=2,color='Black') | plt.plot(x,y,linewidth=2,color='Black') | ||
| − | plt.savefig('struveh0plot.png',bbox_inches='tight',pad_inches=0.15) | + | plt.savefig('struveh0plot.png',bbox_inches='tight',pad_inches=0.15)</pre> |
Latest revision as of 00:05, 22 October 2017
#!/usr/bin/python
import numpy as np
import matplotlib.pyplot as plt
from mpmath import *
from pylab import rcParams
import scipy.special
rcParams['figure.figsize'] = 10, 10

x=np.arange(-30,30,0.001);
f=np.vectorize(lambda x: scipy.special.struve(0,x))
y=f(x)
g=np.vectorize(lambda x: 1)

fig, ax = plt.subplots()

plt.xlabel(r'$x$')
plt.ylabel(r'$\mathbf{H}_0(x)$')

plt.xlim(-30,30)

plt.plot(x,y,linewidth=2,color='Black')

plt.savefig('struveh0plot.png',bbox_inches='tight',pad_inches=0.15)
File history
Click on a date/time to view the file as it appeared at that time.
| Date/Time | Thumbnail | Dimensions | User | Comment | |
|---|---|---|---|---|---|
| current | 00:05, 22 October 2017 | 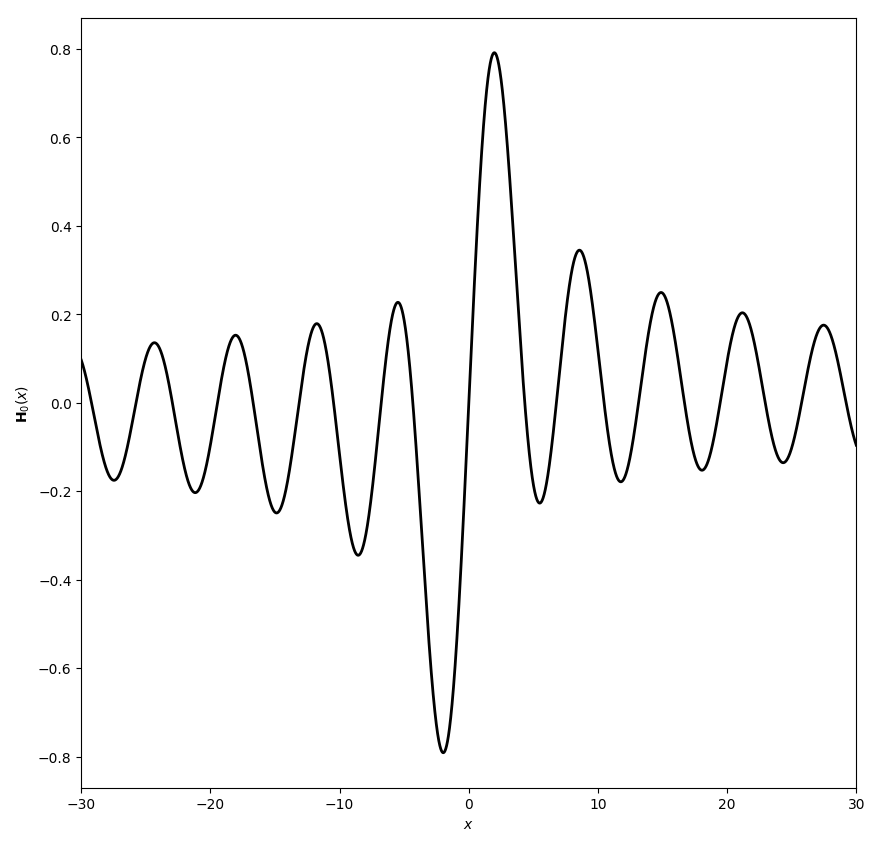 | 880 × 846 (49 KB) | Tom (talk | contribs) | #!/usr/bin/python import numpy as np import matplotlib.pyplot as plt from mpmath import * from pylab import rcParams import scipy.special rcParams['figure.figsize'] = 10, 10 x=np.arange(-30,30,0.001); f=np.vectorize(lambda x: scipy.special.struve(0,x)... |
- You cannot overwrite this file.
File usage
The following page links to this file: