Format notes
This is a list of common code templates and styles we use at specialfunctionswiki.
Theorem/proof box template
The code
<div class="toccolours mw-collapsible mw-collapsed">
<strong>THEOREM/LEMMA/PROPOSITION:</strong> STATEMENT OF THEOREM
<div class="mw-collapsible-content">
<strong>Proof:</strong> proof goes here █
</div>
</div>
creates
THEOREM/LEMMA/PROPOSITION: STATEMENT OF THEOREM
Proof: proof goes here █
Images
Galleries
Put images into galleries. Thumbnails and frames break the theorem/proof box template. The code
<div align="center">
<gallery>
File:Arccos.png|Graph of $\mathrm{arccos}$ on $[-1,1]$.
File:Complex arccos.jpg|[[Domain coloring]] of [[analytic continuation]].
</gallery>
</div>
creates
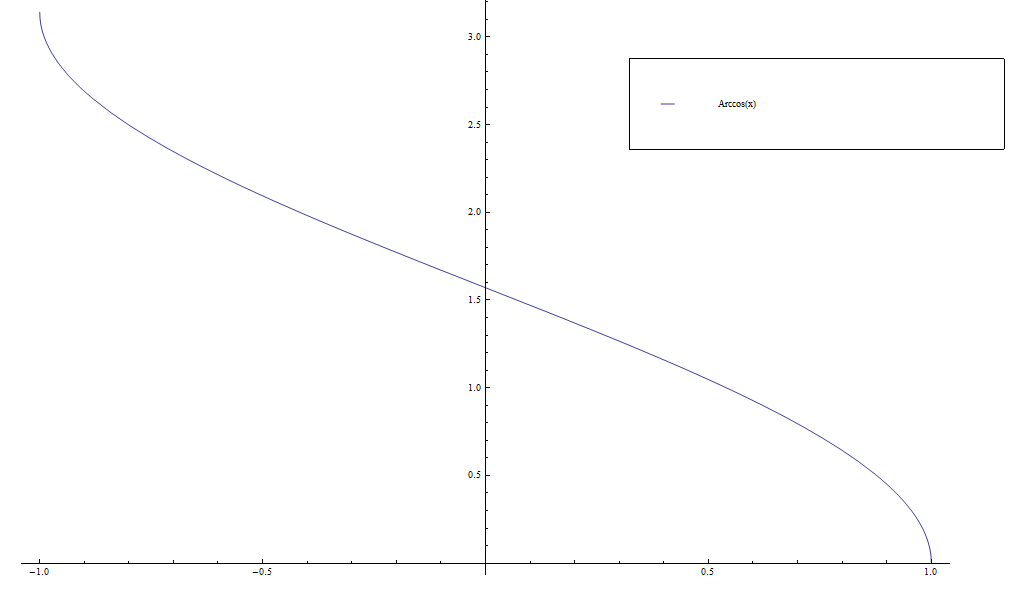
Graph of $\mathrm{arccos}$ on $[-1,1]$.


Domain colorings
With Python (best way)
We modify the code
#!/usr/bin/python
import numpy as np
import matplotlib.pyplot as plt
from mpmath import *

cplot(lambda sin(x): f(x),[-10,10],[-10,10],points=50000,verbose=True)
plt.savefig('complexsinedomaincoloring.png',bbox_inches='tight',pad_inches=0.0)
to generate domain colorings.
With Mathematica (old way)
We use the code
ComplexGraph[f_, {xmin_, xmax_}, {ymin_, ymax_},
  opts : OptionsPattern[]] :=
 RegionPlot[True, {x, xmin, xmax}, {y, ymin, ymax}, opts,
  PlotPoints -> 200, ColorFunctionScaling -> False,
  ColorFunction ->
   Function[{x, y},
    With[{ff = f[x + I y]},
     ColorConvert[
      Hue[(2. Pi)^-1 Mod[Arg[ff], 2 Pi], 1,
       1 - (1.2 + 10 Log[Abs[ff] + 1])^-1], "LAB"]]]]
to generate complex domain colorings. This coloring applied to the identity function $f(z)=z$ with the Mathematica code
 f[z_]:=z
ComplexGraph[f,{-10,10},{-10,10}]
Thumbnails
With Python (best way)
$y=f(x)$-type graphs
#!/usr/bin/python
import numpy as np
import matplotlib.pyplot as plt
from mpmath import *
from pylab import rcParams
rcParams['figure.figsize'] = 2.4,2.4

x=np.arange(0,2*pi,0.00001)
f=np.vectorize(sin)
y=f(x)

fig, ax = plt.subplots()
plt.ylim([-1.1,1.1])
#ax.spines['left'].set_position('center')
ax.spines['right'].set_color('none')
ax.spines['bottom'].set_position('center')
ax.spines['top'].set_color('none')
ax.spines['left'].set_smart_bounds(True)
ax.spines['bottom'].set_smart_bounds(True)
ax.xaxis.set_ticks_position('none')
plt.tick_params(axis='x', which='both', bottom='off', top='off', labelbottom='off')
plt.tick_params(axis='y', which='both', left='off', right='off', labelleft='off')

plt.plot(x,y,linewidth=5,color='Black')

plt.savefig('sineglyph.png',bbox_inches='tight',pad_inches=0.0)
generates

which we upload to the Wiki with name Airyaitglyph.png.
Domain colorings
We use mpmath with the file visualization.py altered in the following way: comment the two following lines
axes.set_xlabel('Re(z)')
axes.set_ylabel('Im(z)')
and add the following line
axes.set_axis_off()
Doing this will get rid of the left and right matter when using cplot. After this, use an image editing program (such as gimp) to cut out a square in the colored region. Upload this raw square with a filename like "complexsineglyph.png" (use prefix complex for domain colorings, without that prefix it should refer to a normal plot-type glyph) and upload that file.
With Mathematica (old way)
We use the Mathematica code
Plot[AiryAi[x], {x, -12, 3}, PlotStyle -> {Thickness[0.04], Black}, AxesStyle -> Thickness[0.01], Ticks -> None]
to output the image

which we upload to the Wiki with name Airyaithumb.png use a thumbnail in an HTML table cell with the code
<td><center>[[File:Airyaithumb.png|45px|link=Airy Ai]]<br />
[[Airy Ai]]</center></td>
to display it.
Extensions
RandomImageByCategory
We use a modified version of RandomImageByCategory: inside RandomImageByCategory.php, replace the line
$thumbnail = "<a href=\"" . htmlspecialchars( $image_title->getFullURL() ) . "\">{$thumb_image->toHtml()}</a>";
with
$thumbnail = "{$thumb_image->toHtml()}";
This prevents RandomImageByCategory from forcing the generated image to link to the image itself and allows you make a randomly generated image link to another page using the following code:
[[Sine|<randomimagebycategory categories="Sineglyph" width="45" />]]
generates the randomly chosen image from the category Sineglyph
![]()
Categories
When uploading a traditional $x$-axis $y$-axis plot, use[[Category:Plot]]
When uploading a domain coloring, use
[[Category:DomainColoring]]
Python
Whenever we use Python to generate an image that contains LaTeX code, we have configured matplotlibrc with the following:
text.usetex : True
and we often have
text.latex.preamble : \usepackage{amsmath}