File list
This special page shows all uploaded files.
First page |
Previous page |
Next page |
Last page |
| Date | Name | Thumbnail | Size | User | Description | Versions |
|---|---|---|---|---|---|---|
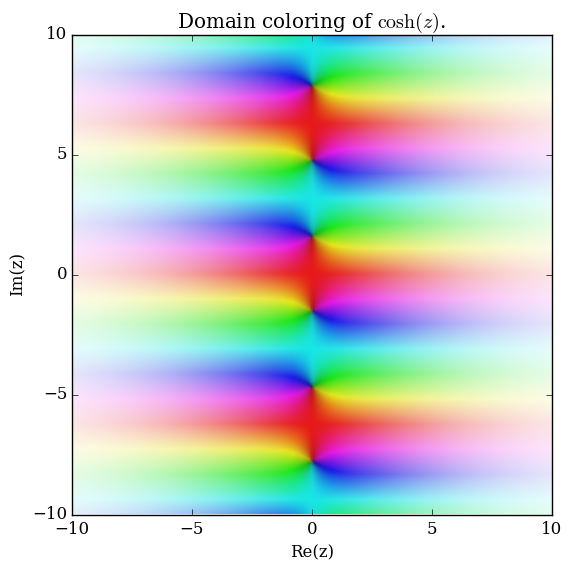
| 08:09, 16 May 2016 | Complexcoshplot.png (file) |  |
102 KB | Tom | Category:DomainColoring <pre>#!/usr/bin/python import numpy as np import matplotlib.pyplot as plt from mpmath import * cplot(cosh,[-10,10],[-10,10],points=50000,verbose=True) plt.title('Domain coloring of $\mathrm{cosh}(z)$.') plt.savefig('complex... | 1 |
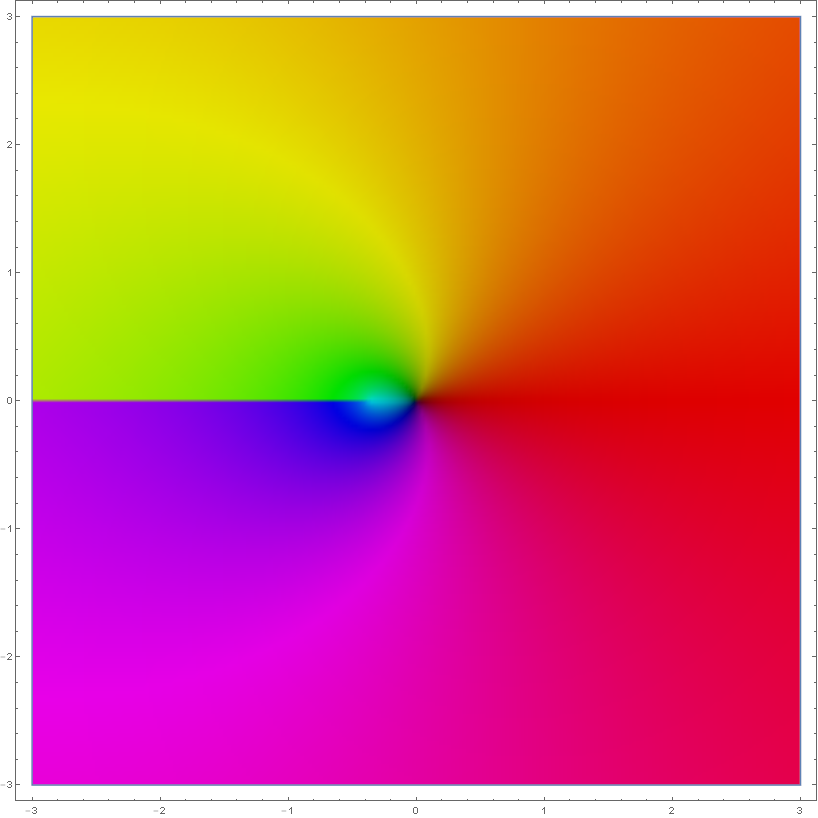
| 20:30, 19 February 2015 | Complexlambertw0.png (file) |  |
103 KB | Tom | ComplexGraph[ProductLog, {-3, 3}, {-3, 3}], where ComplexGraph is defined in format notes | 1 |
| 02:48, 21 August 2015 | Domcoljacobisd.png (file) |  |
103 KB | Tom | test[z_] := JacobiSD[z, 0.8] ComplexGraph[test, {-10, 10}, {-10, 10}] | 1 |
| 02:37, 21 August 2015 | Domcoljacobinc.png (file) |  |
103 KB | Tom | test[z_] := JacobiNC[z, 0.8] ComplexGraph[test, {-10, 10}, {-10, 10}] | 1 |
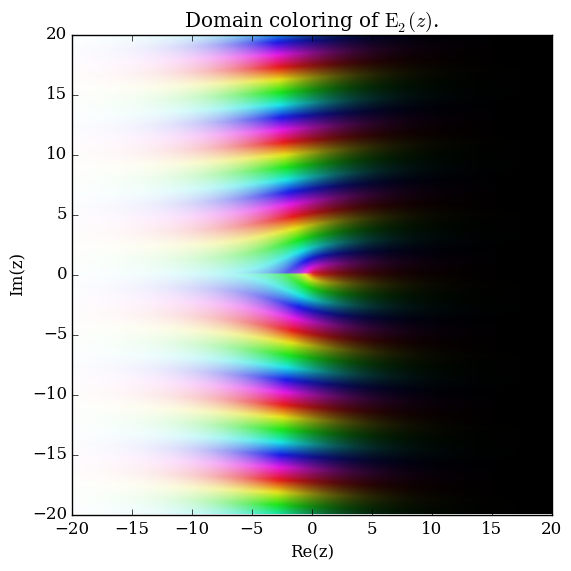
| 21:00, 23 May 2016 | Complexe2plot.png (file) |  |
104 KB | Tom | Category:DomainColoring <pre>#!/usr/bin/python import numpy as np import matplotlib.pyplot as plt from mpmath import * def plotme(x): return expint(2,x) cplot(plotme,[-20,20],[-20,20],points=50000,verbose=True) plt.title(r'Domain coloring... | 1 |
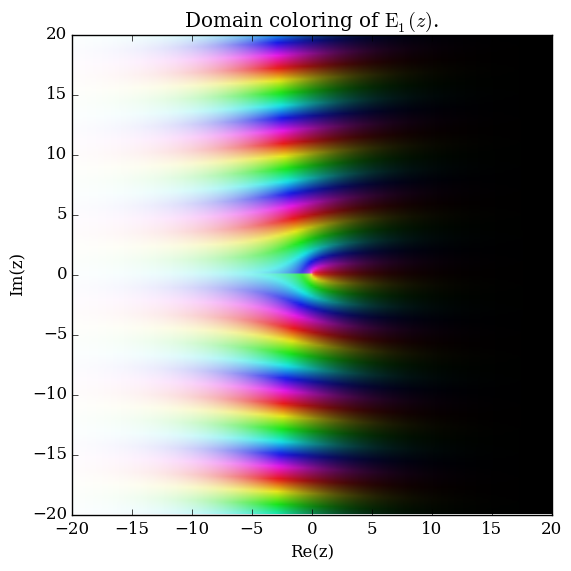
| 20:49, 23 May 2016 | Complexe1plot.png (file) |  |
104 KB | Tom | Category:DomainColoring <pre>#!/usr/bin/python import numpy as np import matplotlib.pyplot as plt from mpmath import * def plotme(x): return expint(1,x) cplot(plotme,[-20,20],[-20,20],points=50000,verbose=True) plt.title(r'Domain coloring... | 1 |
| 08:05, 16 May 2016 | Complexsinhplot.png (file) |  |
104 KB | Tom | Category:DomainColoring <pre>#!/usr/bin/python import numpy as np import matplotlib.pyplot as plt from mpmath import * cplot(sinh,[-10,10],[-10,10],points=50000,verbose=True) plt.title('Domain coloring of $\mathrm{sinh}(z)$.') plt.savefig('complex... | 1 |
| 05:27, 19 October 2014 | Complex Coth.jpg (file) |  |
105 KB | Tom | http://en.wikipedia.org/wiki/File:Complex_ArcCoth.jpg | 2 |
| 02:03, 21 August 2015 | Domcoljacobicn.png (file) |  |
105 KB | Tom | test[z_] := JacobiCN[z, 0.8] ComplexGraph[test, {-10, 10}, {-10, 10}] | 1 |
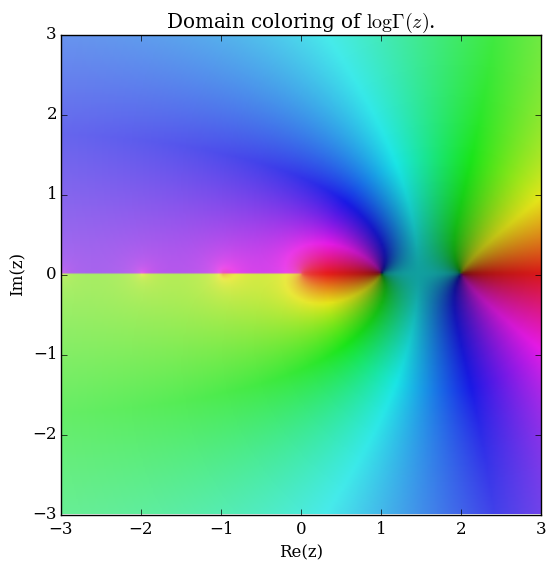
| 00:29, 24 May 2016 | Complexloggammaplot.png (file) |  |
105 KB | Tom | Category:DomainColoring <pre>#!/usr/bin/python import numpy as np import matplotlib.pyplot as plt from mpmath import * cplot(loggamma,[-3,3],[-3,3],points=50000,verbose=True) plt.title(r'Domain coloring of $\log \Gamma(z)$.') plt.savefig('complexl... | 1 |
| 02:34, 21 August 2015 | Domcoljacobids.png (file) |  |
106 KB | Tom | test[z_] := JacobiDS[z, 0.8] ComplexGraph[test, {-10, 10}, {-10, 10}] | 1 |
| 05:37, 18 May 2015 | Complex tanc.png (file) |  |
106 KB | Tom | g[z_] := Tan[z]/z ComplexGraph[g, {-10, 10}, {-10, 10}] | 1 |
| 17:04, 14 October 2014 | Beta2.png (file) |  |
106 KB | Tom | 1 | |
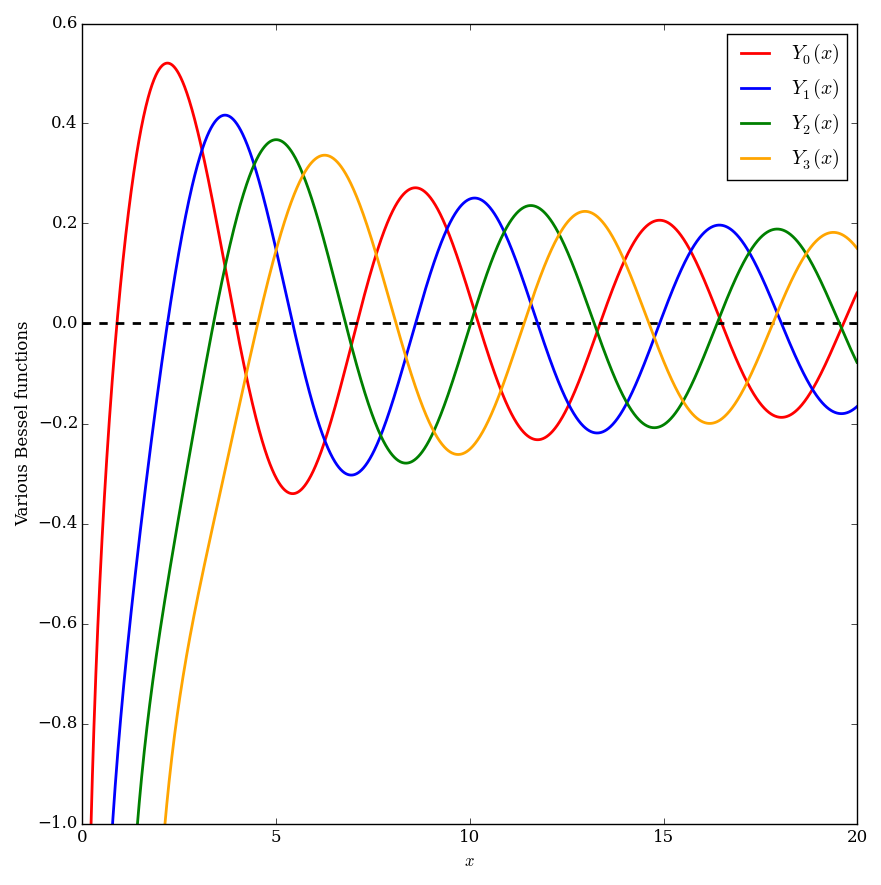
| 19:24, 10 June 2016 | Multiplebesselyplot.png (file) |  |
107 KB | Tom | Category:Plot <pre>#!/usr/bin/python import numpy as np import matplotlib.pyplot as plt from mpmath import * from pylab import rcParams rcParams['figure.figsize'] = 10, 10 x=np.arange(0.01,20,0.01); j0=np.vectorize(lambda x: bessely(0,x)) j1=np.ve... | 1 |
| 05:26, 19 October 2014 | Complex ArcTanh.jpg (file) |  |
107 KB | Tom | http://en.wikipedia.org/wiki/File:Complex_ArcTanh.jpg | 1 |
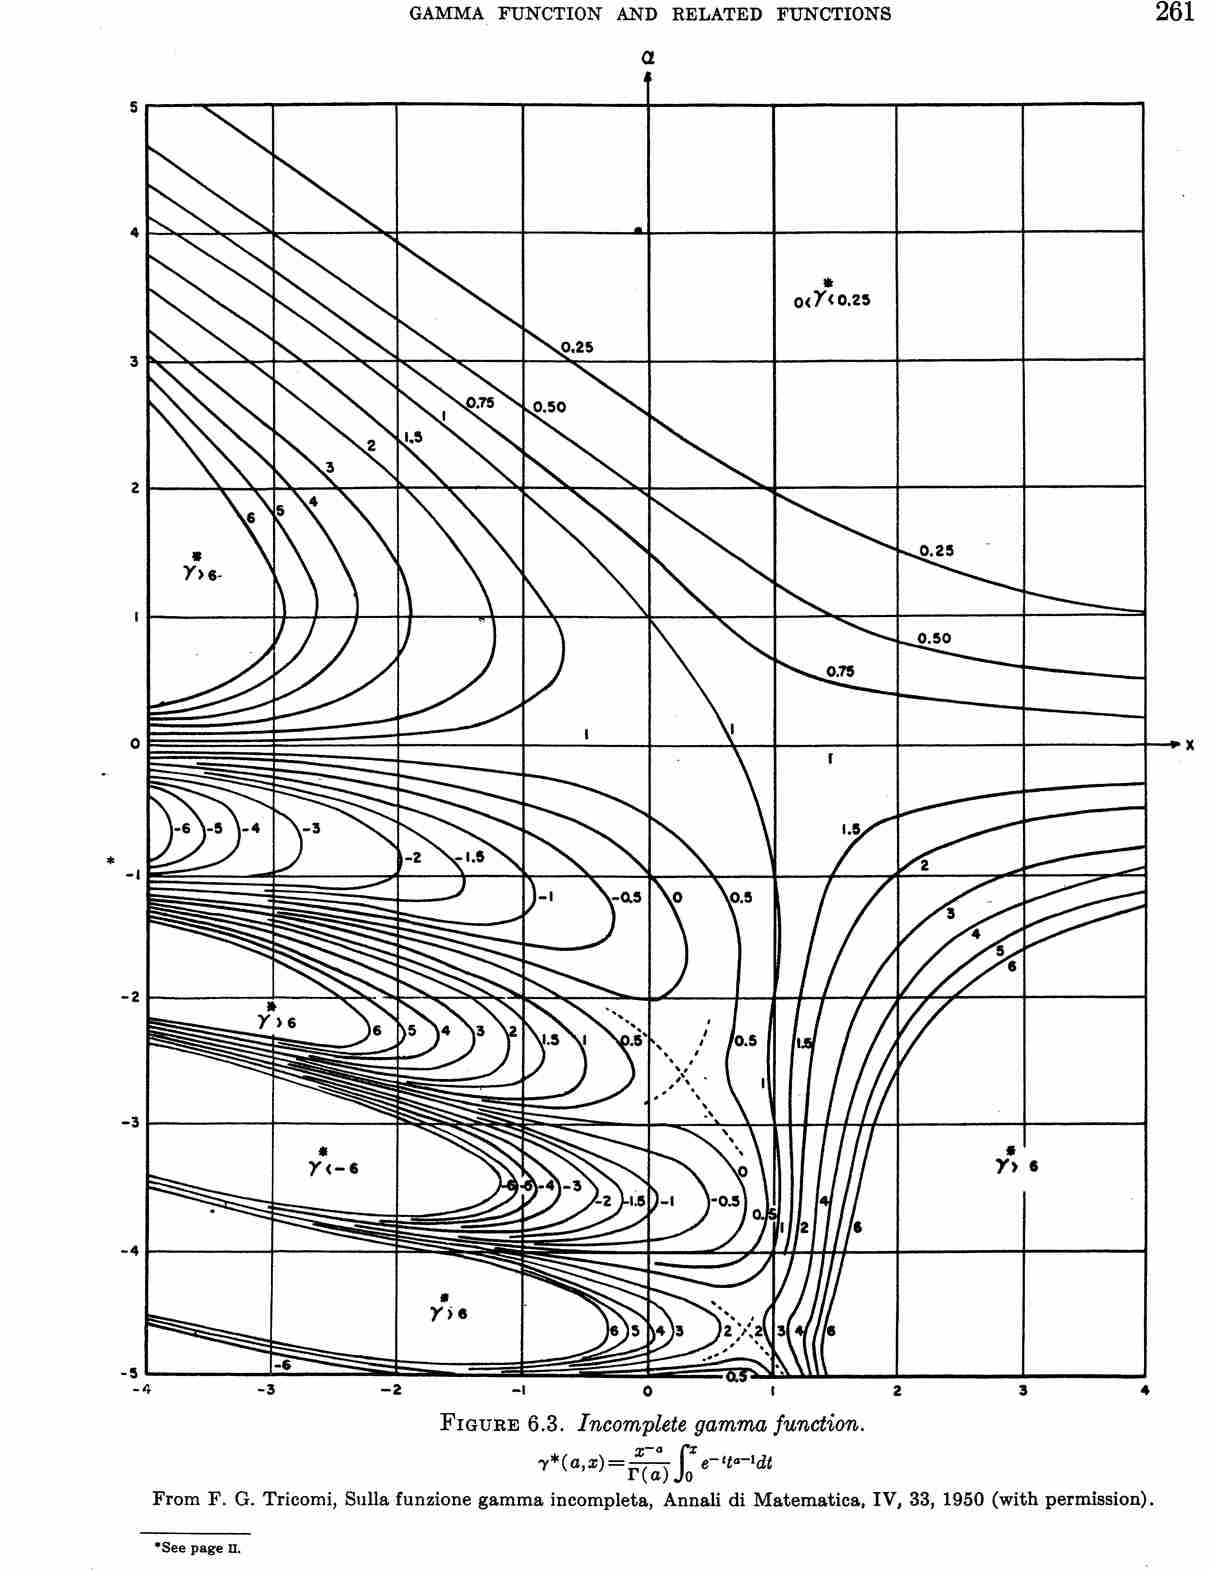
| 18:42, 28 June 2015 | Lowerincompletegamma(abramowitzandstegun).jpg (file) | .jpg) |
108 KB | Tom | http://dualaud.net/specialfunctionswiki/abramowitz_and_stegun-1.03/page_261.htm | 1 |
| 05:25, 19 October 2014 | Complex ArcSinh.jpg (file) |  |
110 KB | Tom | 1 | |
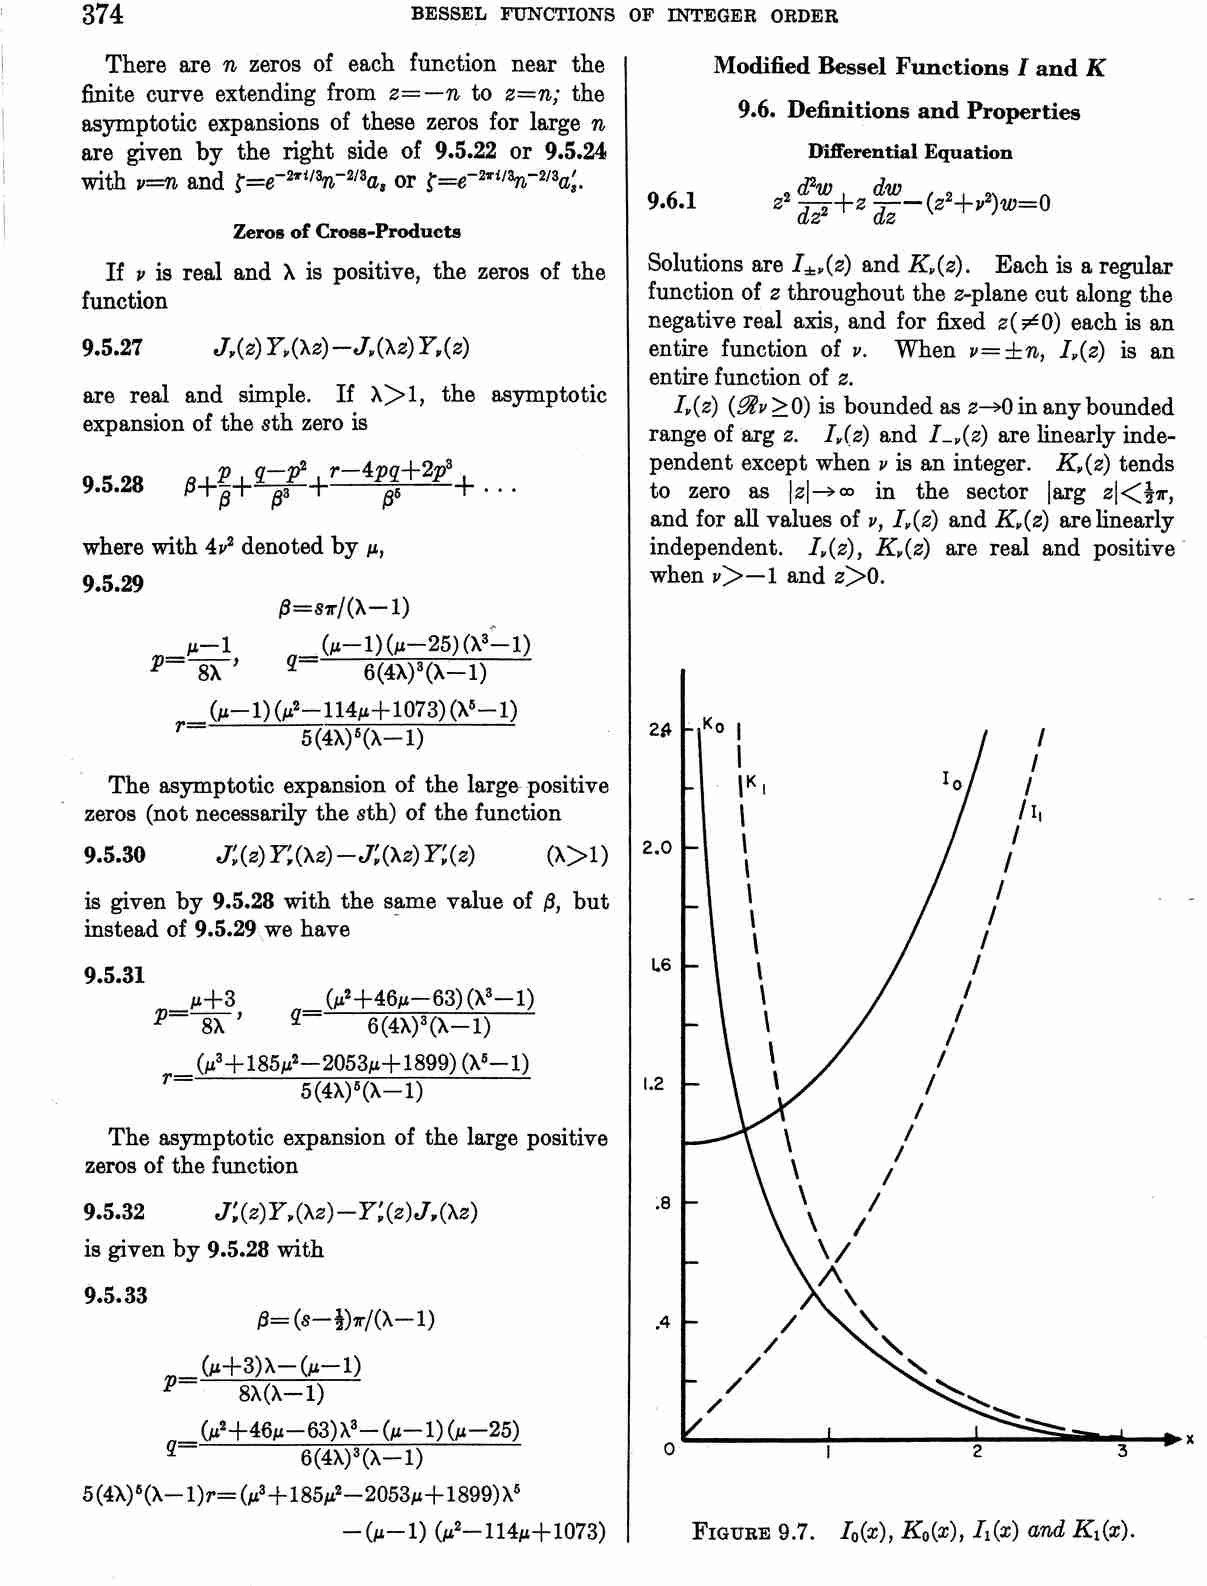
| 17:45, 25 July 2015 | Page 374 (Abramowitz&Stegun).jpg (file) | .jpg) |
110 KB | Tom | http://dualaud.net/specialfunctionswiki/abramowitz_and_stegun-1.03/page_374.htm | 1 |
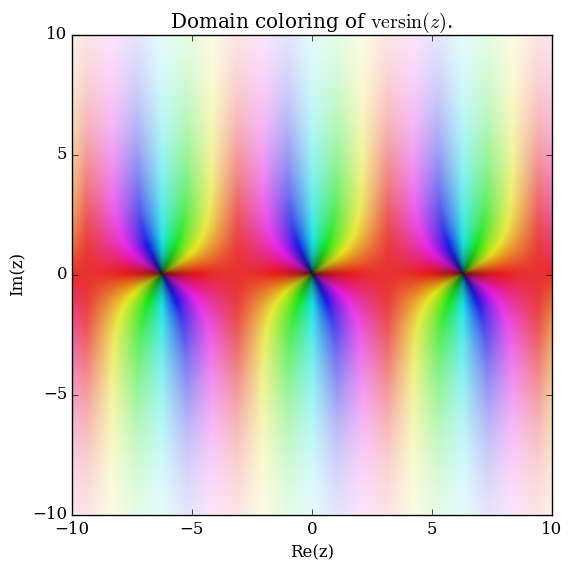
| 04:16, 4 October 2016 | Complexversinplot.png (file) |  |
112 KB | Tom | Category:DomainColoring <pre> #!/usr/bin/python import numpy as np import matplotlib.pyplot as plt from mpmath import * cplot(lambda x: 1-cos(x),[-10,10],[-10,10],points=50000,verbose=True) plt.title(r'Domain coloring of $\mathrm{versin}(z)$.') pl... | 2 |
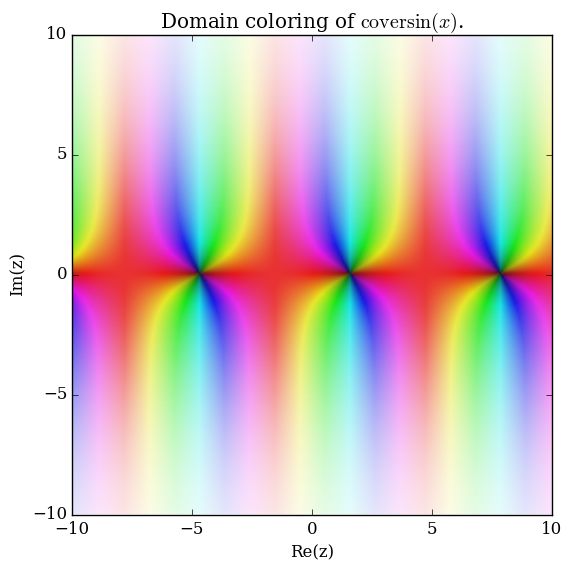
| 04:27, 3 October 2016 | Complexcoversinplot.png (file) |  |
112 KB | Tom | Category:DomainColoring <pre> #!/usr/bin/python import numpy as np import matplotlib.pyplot as plt from mpmath import * cplot(lambda x: 1-sin(x),[-10,10],[-10,10],points=50000,verbose=True) plt.title(r'Domain coloring of $\mathrm{coversin}(x)$.')... | 1 |
| 18:52, 25 July 2015 | Domain coloring fresnel c.png (file) |  |
112 KB | Tom | ComplexGraph[FresnelC, {-3, 3}, {-3, 3}] | 1 |
| 20:14, 23 May 2016 | Complexanger1.5plot.png (file) |  |
112 KB | Tom | Category:DomainColoring <pre>#!/usr/bin/python import numpy as np import matplotlib.pyplot as plt from mpmath import * def angerintegrand(t,n,x): return cos(n*t-x*sin(t)) def anger(n,x): return (1/pi)*quad(lambda t: angerintegrand(... | 1 |
| 18:53, 25 July 2015 | Domain coloring fresnel s.png (file) |  |
113 KB | Tom | ComplexGraph[FresnelS, {-3, 3}, {-3, 3}] | 1 |
| 18:48, 28 June 2015 | Gamma and reciprocal gamma (abramowitzandstegun).png (file) | .png) |
114 KB | Tom | http://dualaud.net/specialfunctionswiki/abramowitz_and_stegun-1.03/page_255.htm | 1 |
| 17:33, 23 May 2016 | Complexanger1plot.png (file) |  |
115 KB | Tom | Category:DomainColoring <pre>#!/usr/bin/python import numpy as np import matplotlib.pyplot as plt from mpmath import * def angerintegrand(t,n,x): return cos(n*t-x*sin(t)) def anger(n,x): return (1/pi)*quad(lambda t: angerintegrand(... | 1 |
| 06:03, 10 June 2015 | Page 359Abramowitz-Stegun(Bessel functions).jpg (file) | .jpg) |
115 KB | Tom | Source Abramowitz&Stegun pg.359: http://dualaud.net/specialfunctionswiki/abramowitz_and_stegun-1.03/page_359.htm | 1 |
| 23:24, 10 June 2016 | Complexbesseli,n=1plot.png (file) |  |
117 KB | Tom | Category:DomainColoring <pre>#!/usr/bin/python import numpy as np import matplotlib.pyplot as plt from mpmath import * cplot(lambda x: besseli(1,x),[-15,15],[-15,15],points=50000,verbose=True) plt.title(r'Domain coloring of $I_1(z)$.') plt.savefig... | 1 |
| 16:59, 23 May 2016 | Complexanger0plot.png (file) |  |
118 KB | Tom | Category:DomainColoring <pre>#!/usr/bin/python import numpy as np import matplotlib.pyplot as plt from mpmath import * def angerintegrand(t,n,x): return cos(n*t-x*sin(t)) def anger(n,x): return (1/pi)*quad(lambda t: angerintegrand(... | 1 |
| 17:14, 23 May 2016 | Complexanger0.5plot.png (file) |  |
118 KB | Tom | Category:DomainColoring <pre>#!/usr/bin/python import numpy as np import matplotlib.pyplot as plt from mpmath import * def angerintegrand(t,n,x): return cos(n*t-x*sin(t)) def anger(n,x): return (1/pi)*quad(lambda t: angerintegrand(... | 1 |
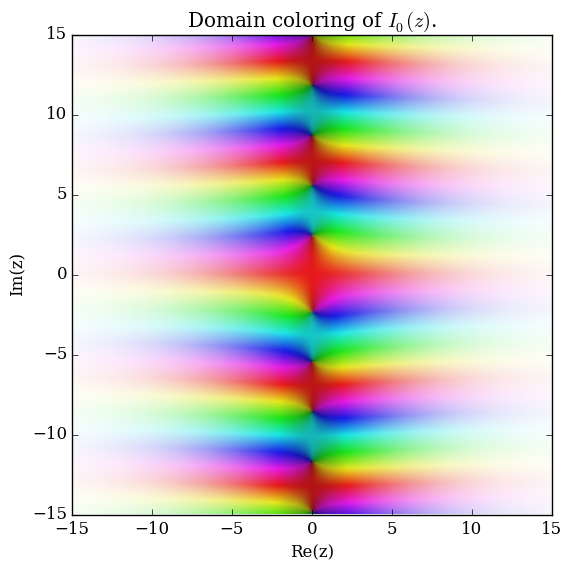
| 23:22, 10 June 2016 | Complexbesseli,n=0plot.png (file) |  |
119 KB | Tom | Category:DomainColoring <pre>#!/usr/bin/python import numpy as np import matplotlib.pyplot as plt from mpmath import * cplot(lambda x: besseli(0,x),[-15,15],[-15,15],points=50000,verbose=True) plt.title(r'Domain coloring of $I_0(z)$.') plt.savefig... | 1 |
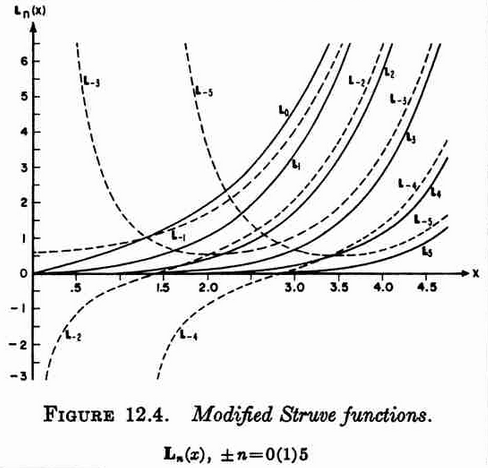
| 18:31, 28 June 2015 | Modifiedstruve(abramandstegun).png (file) | .png) |
120 KB | Tom | http://dualaud.net/specialfunctionswiki/abramowitz_and_stegun-1.03/page_498.htm | 1 |
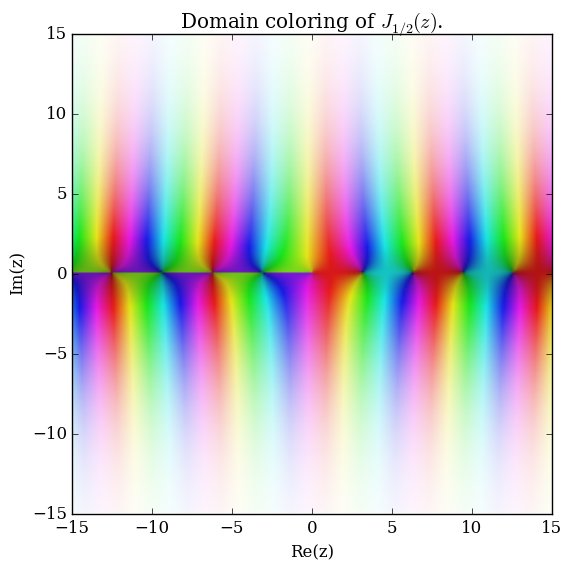
| 07:10, 24 May 2016 | Complexbesselj0.5plot.png (file) |  |
121 KB | Tom | Category:DomainColoring <pre>#!/usr/bin/python import numpy as np import matplotlib.pyplot as plt from mpmath import * cplot(lambda x: besselj(0.5,x),[-15,15],[-15,15],points=50000,verbose=True) plt.title(r'Domain coloring of $J_{1/2}(z)$.') plt.s... | 1 |
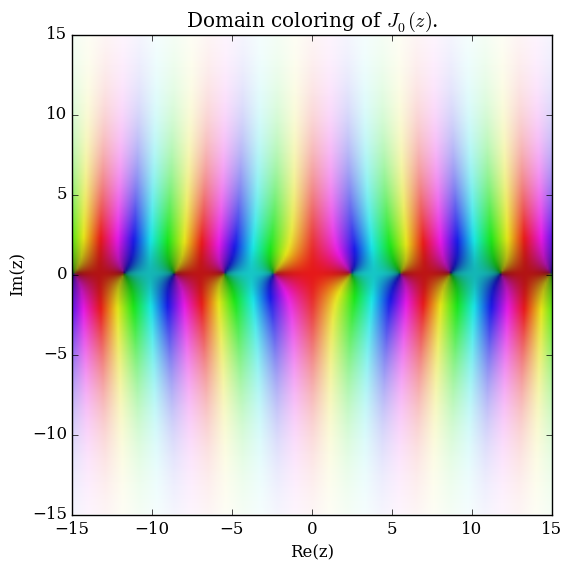
| 07:02, 24 May 2016 | Complexbesselj0plot.png (file) |  |
121 KB | Tom | Category:DomainColoring <pre>#!/usr/bin/python import numpy as np import matplotlib.pyplot as plt from mpmath import * cplot(lambda x: besselj(0,x),[-15,15],[-15,15],points=50000,verbose=True) plt.title(r'Domain coloring of $J_0(z)$.') plt.savefig... | 1 |
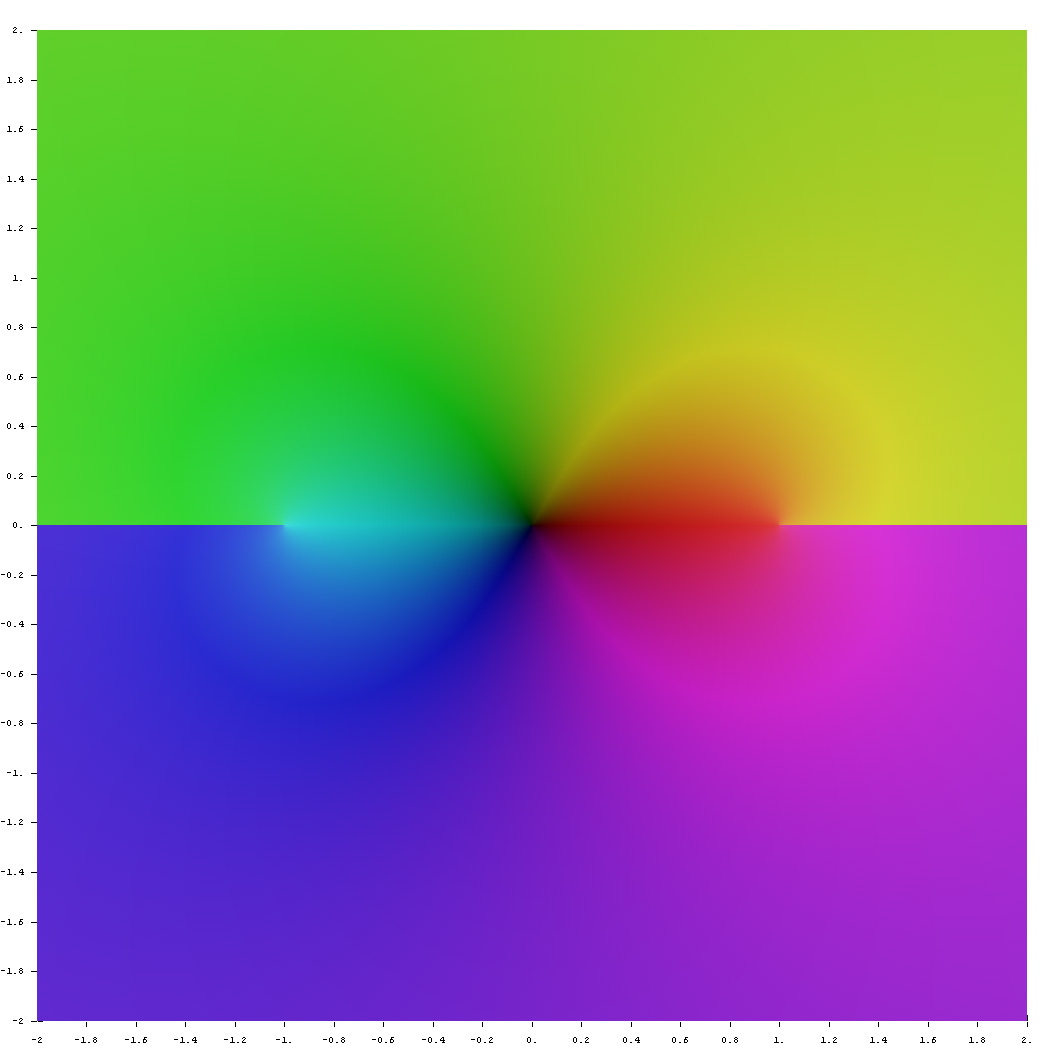
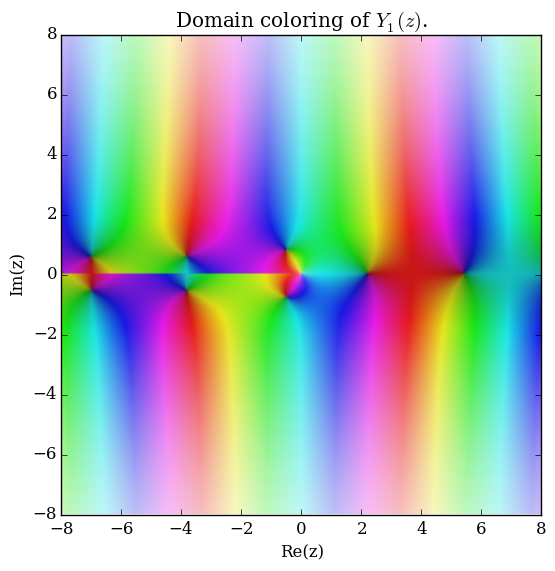
| 20:08, 9 June 2016 | Complexbessely,n=1.png (file) |  |
122 KB | Tom | Category:DomainColoring <pre>#!/usr/bin/python import numpy as np import matplotlib.pyplot as plt from mpmath import * cplot(lambda x: bessely(1,x),[-8,8],[-8,8],points=50000,verbose=True) plt.title(r'Domain coloring of $Y_1(z)$.') plt.savefig('co... | 1 |
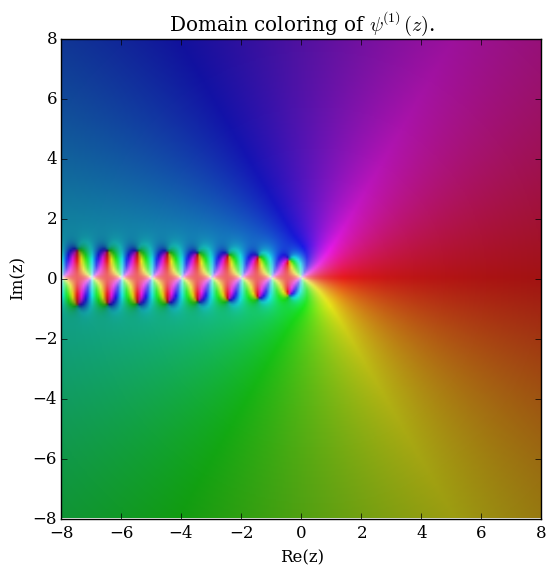
| 18:57, 3 June 2016 | Complexpolygamma,k=1plot.png (file) |  |
123 KB | Tom | Category:DomainColoring <pre>#!/usr/bin/python import numpy as np import matplotlib.pyplot as plt from mpmath import * cplot(lambda x: polygamma(1,x),[-8,8],[-8,8],points=50000,verbose=True) plt.title(r'Domain coloring of $\psi^{(1)}(z)$.') plt.sa... | 1 |
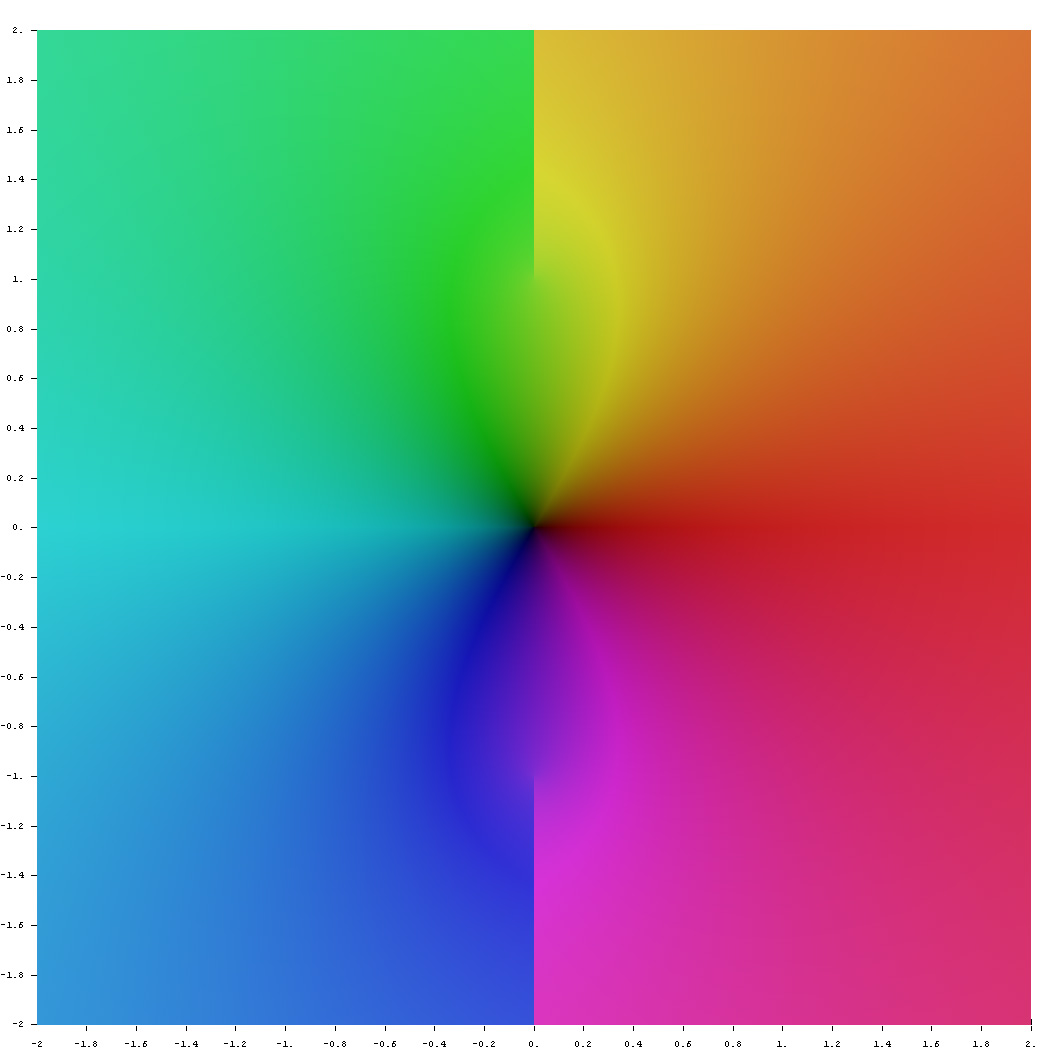
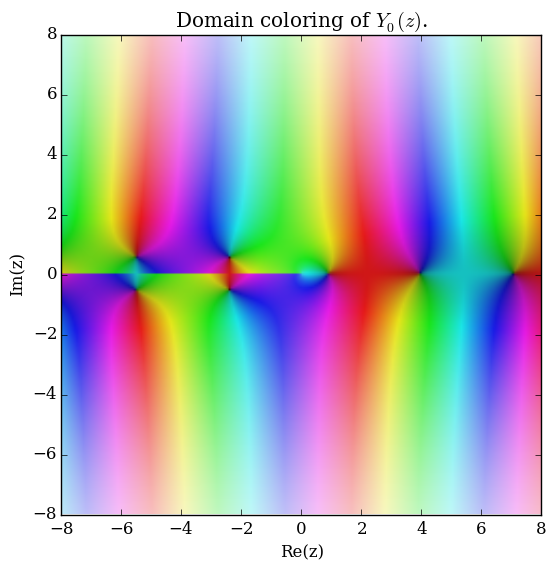
| 20:06, 9 June 2016 | Complexbessely,n=0.png (file) |  |
124 KB | Tom | Category:DomainColoring <pre>#!/usr/bin/python import numpy as np import matplotlib.pyplot as plt from mpmath import * cplot(lambda x: bessely(0,x),[-8,8],[-8,8],points=50000,verbose=True) plt.title(r'Domain coloring of $Y_0(z)$.') plt.savefig('co... | 1 |
| 20:38, 19 February 2015 | Complexidentity.png (file) |  |
125 KB | Tom | ident[z_] := z ComplexGraph[ident, {-10, 10}, {-10, 10}], where ComplexGraph is defined in format notes | 1 |
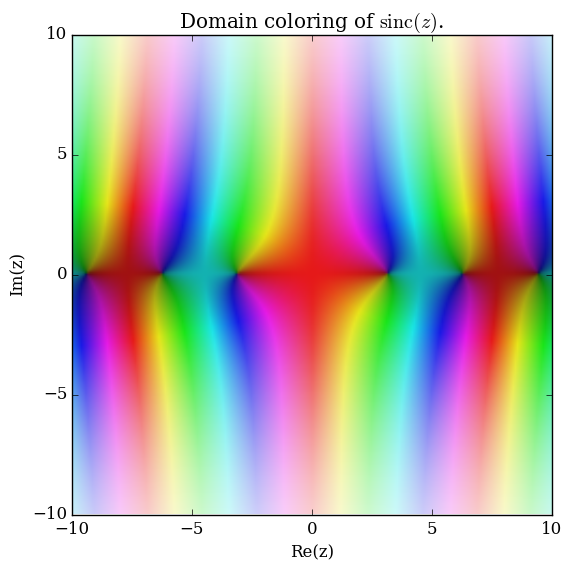
| 04:54, 25 July 2015 | Page 998.jpg (file) |  |
127 KB | Tom | http://dualaud.net/specialfunctionswiki/abramowitz_and_stegun-1.03/page_998.htm | 1 |
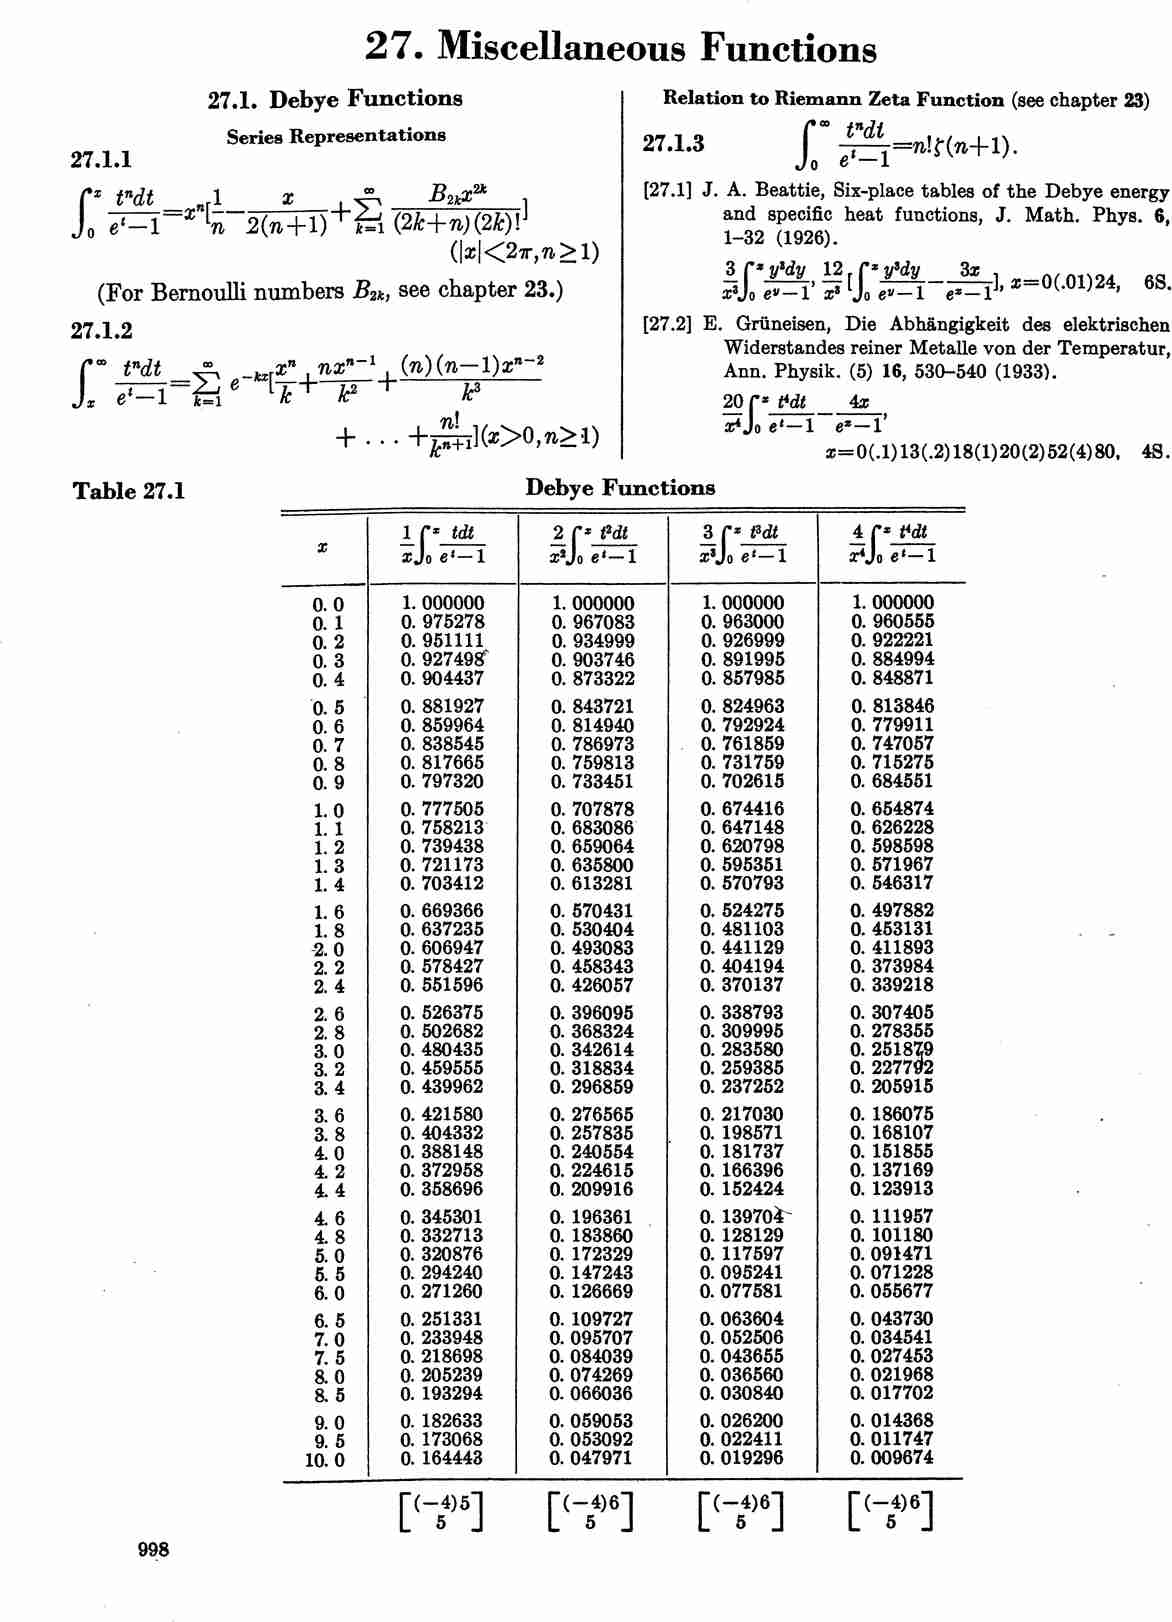
| 05:33, 17 May 2016 | Complexcoshcplot.png (file) |  |
131 KB | Tom | Category:DomainColoring <pre>#!/usr/bin/python import numpy as np import matplotlib.pyplot as plt from mpmath import * def f(x): return cosh(x)/x cplot(f,[-10,10],[-10,10],points=50000,verbose=True) plt.title(r'Domain coloring of $\mathrm... | 1 |
| 04:57, 19 October 2014 | Complex arccos.jpg (file) |  |
131 KB | Tom | http://en.wikipedia.org/wiki/File:Complex_arccos.jpg | 1 |
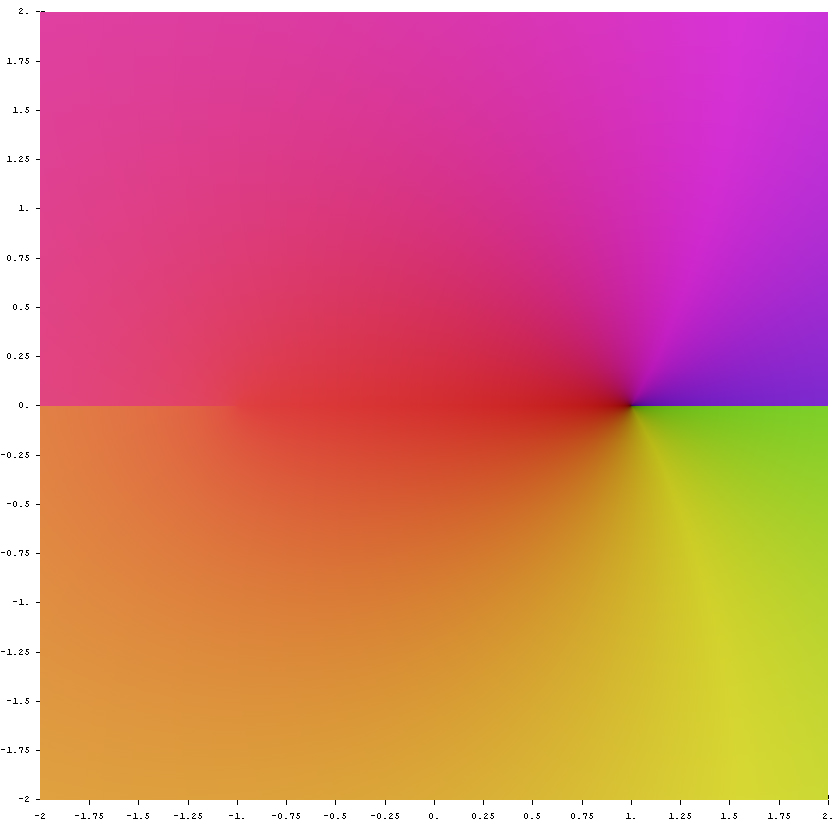
| 05:45, 17 May 2016 | Complexsincplot.png (file) |  |
132 KB | Tom | Category:DomainColoring <pre>#!/usr/bin/python import numpy as np import matplotlib.pyplot as plt from mpmath import * cplot(sinc,[-10,10],[-10,10],points=50000,verbose=True) plt.title(r'Domain coloring of $\mathrm{sinc}(z)$.') plt.savefig('comple... | 1 |
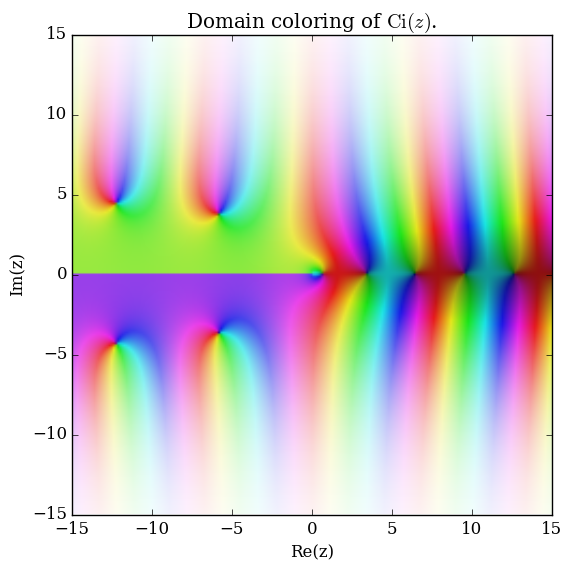
| 21:33, 23 May 2016 | Complexciplot.png (file) |  |
137 KB | Tom | Category:DomainColoring <pre>#!/usr/bin/python import numpy as np import matplotlib.pyplot as plt from mpmath import * cplot(ci,[-15,15],[-15,15],points=50000,verbose=True) plt.title(r'Domain coloring of $\mathrm{Ci}(z)$.') plt.savefig('complexcip... | 1 |
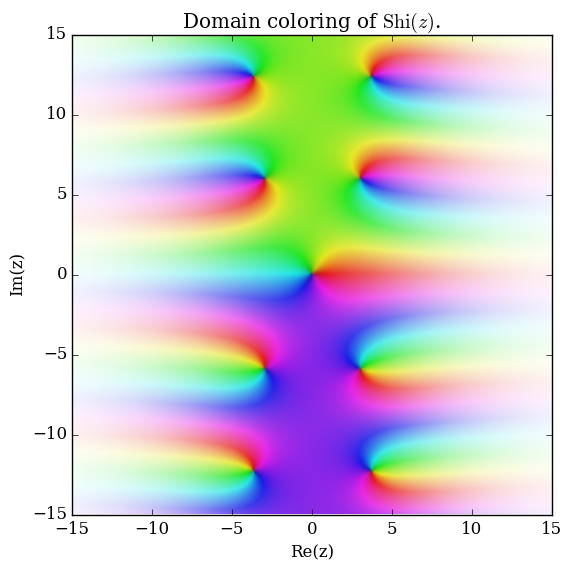
| 22:09, 23 May 2016 | Complexshiplot.png (file) |  |
137 KB | Tom | Category:DomainColoring <pre>#!/usr/bin/python import numpy as np import matplotlib.pyplot as plt from mpmath import * cplot(shi,[-15,15],[-15,15],points=50000,verbose=True) plt.title(r'Domain coloring of $\mathrm{Shi}(z)$.') plt.savefig('complexs... | 1 |
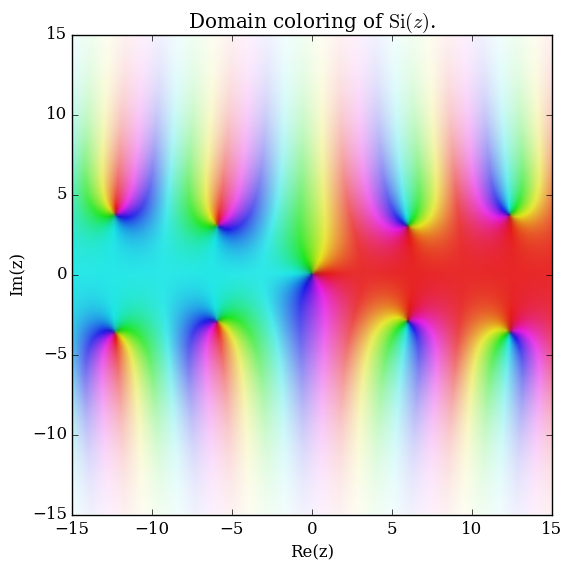
| 21:36, 23 May 2016 | Complexsiplot.png (file) |  |
138 KB | Tom | Category:DomainColoring <pre>#!/usr/bin/python import numpy as np import matplotlib.pyplot as plt from mpmath import * cplot(si,[-15,15],[-15,15],points=50000,verbose=True) plt.title(r'Domain coloring of $\mathrm{Si}(z)$.') plt.savefig('complexsip... | 1 |
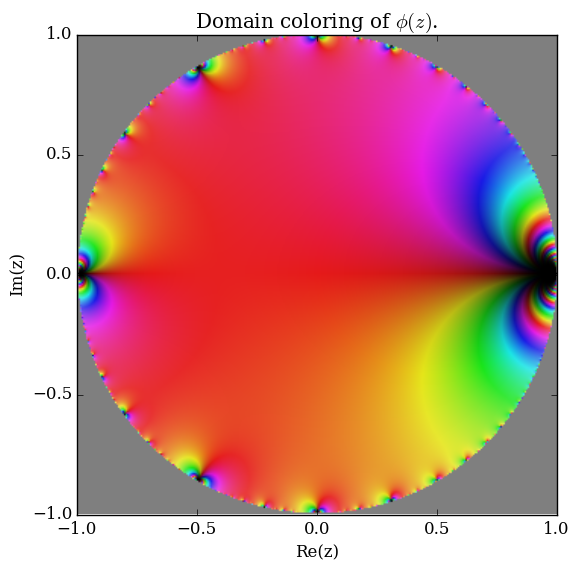
| 03:58, 22 June 2016 | Complexeulerphiplot.png (file) |  |
139 KB | Tom | Category:DomainColoring <pre>#!/usr/bin/python import numpy as np import matplotlib.pyplot as plt from mpmath import * cplot(lambda x: qp(x),[-1,1],[-1,1],points=100000,verbose=True) plt.title(r'Domain coloring of $\phi(z)$.') plt.savefig('complex... | 1 |
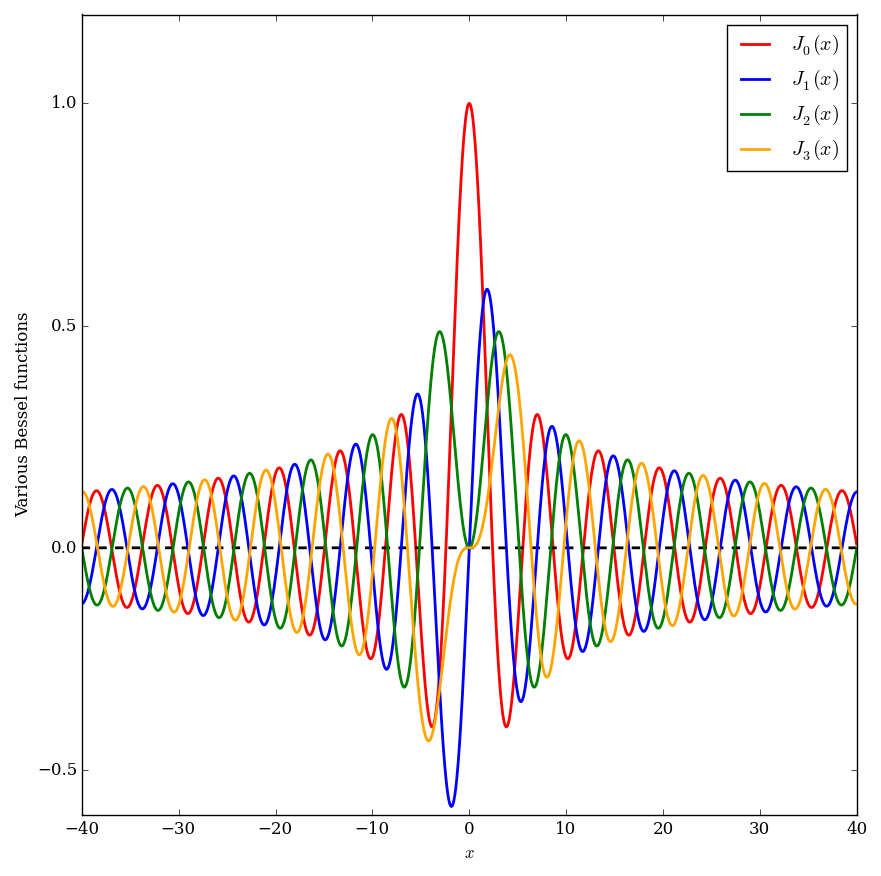
| 19:27, 10 June 2016 | Multiplebesseljplot.png (file) |  |
139 KB | Tom | Category:Plot <pre>#!/usr/bin/python import numpy as np import matplotlib.pyplot as plt from mpmath import * from pylab import rcParams rcParams['figure.figsize'] = 10, 10 x=np.arange(-40,40,0.01); j0=np.vectorize(lambda x: besselj(0,x)) j1=np.vec... | 2 |
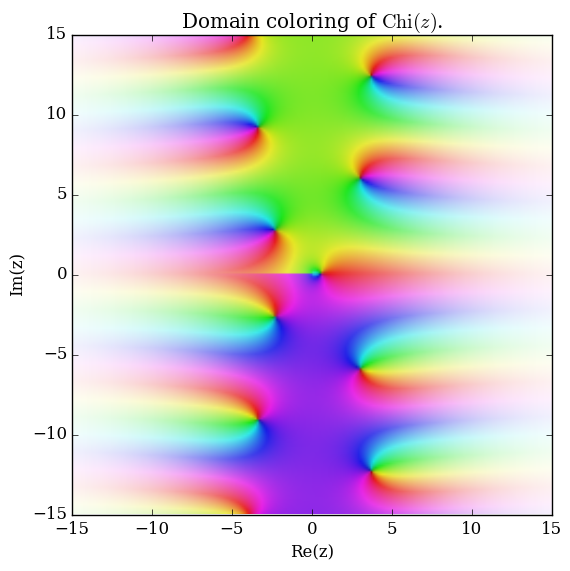
| 21:59, 23 May 2016 | Complexchiplot.png (file) |  |
139 KB | Tom | Category:DomainColoring <pre>#!/usr/bin/python import numpy as np import matplotlib.pyplot as plt from mpmath import * cplot(chi,[-15,15],[-15,15],points=50000,verbose=True) plt.title(r'Domain coloring of $\mathrm{Chi}(z)$.') plt.savefig('complexc... | 1 |
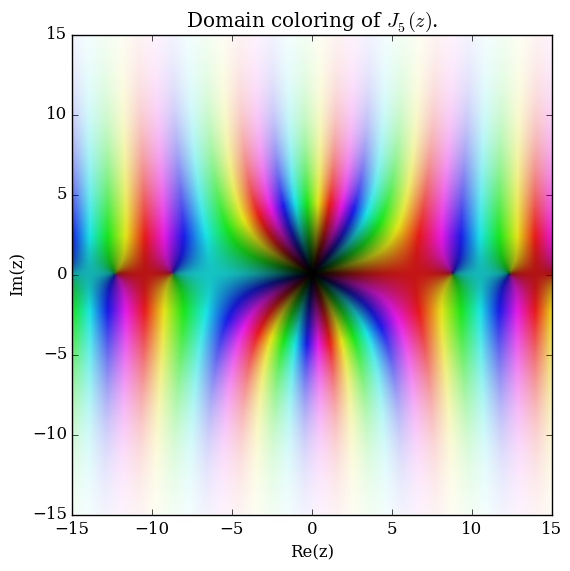
| 07:06, 24 May 2016 | Complexbesselj5plot.png (file) |  |
143 KB | Tom | Category:DomainColoring <pre>#!/usr/bin/python import numpy as np import matplotlib.pyplot as plt from mpmath import * cplot(lambda x: besselj(5,x),[-15,15],[-15,15],points=50000,verbose=True) plt.title(r'Domain coloring of $J_5(z)$.') plt.savefig... | 1 |
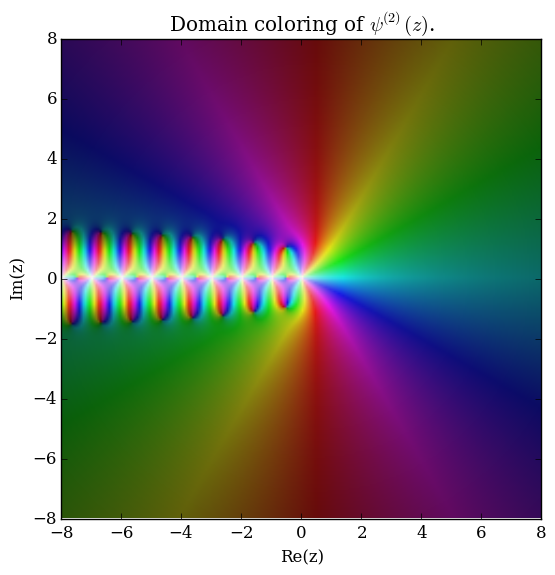
| 19:02, 3 June 2016 | Complexpolygamma,k=2plot.png (file) |  |
144 KB | Tom | Category:DomainColoring <pre>#!/usr/bin/python import numpy as np import matplotlib.pyplot as plt from mpmath import * cplot(lambda x: polygamma(2,x),[-8,8],[-8,8],points=50000,verbose=True) plt.title(r'Domain coloring of $\psi^{(2)}(z)$.') plt.sa... | 1 |
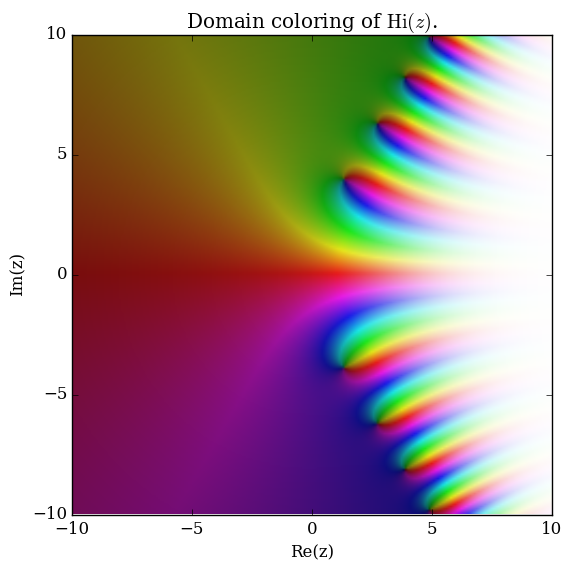
| 22:46, 9 June 2016 | Complexscorerhi.png (file) |  |
147 KB | Tom | Category:DomainColoring <pre>#!/usr/bin/python import numpy as np import matplotlib.pyplot as plt from mpmath import * cplot(scorerhi,[-10,10],[-10,10],points=50000,verbose=True) plt.title(r'Domain coloring of $\mathrm{Hi}(z)$.') plt.savefig('comp... | 1 |
First page |
Previous page |
Next page |
Last page |