File list
This special page shows all uploaded files.
First page |
Previous page |
Next page |
Last page |
| Date | Name | Thumbnail | Size | User | Description | Versions |
|---|---|---|---|---|---|---|
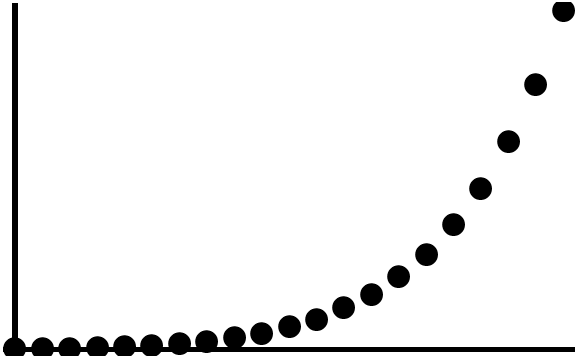
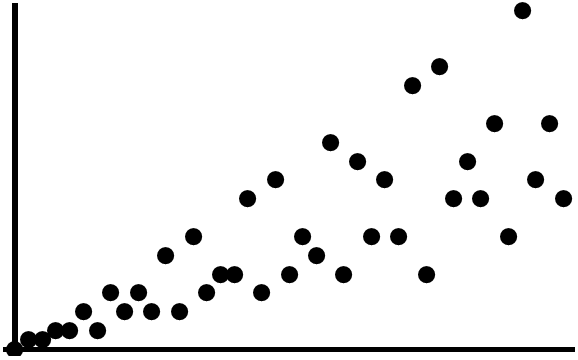
| 08:29, 19 January 2015 | Partitionthumb.png (file) |  |
6 KB | Tom | DiscretePlot[PartitionsP[k], {k, 0, 20}, PlotStyle -> {PointSize[0.04], Black}, FillingStyle -> None, AxesStyle -> Thickness[0.01], AxesStyle -> Thickness[0.01], Ticks -> None] | 1 |
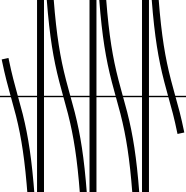
| 17:57, 9 June 2016 | Jacobics,m=0.8glyph.png (file) |  |
6 KB | Tom | Category:Jacobicsglyph <pre>#!/usr/bin/python import numpy as np import matplotlib.pyplot as plt from mpmath import * from pylab import rcParams rcParams['figure.figsize'] = 2.4,2.4 x=np.arange(-7.5,7.5,0.001) f=np.vectorize(lambda x: ellipfun('cs... | 1 |
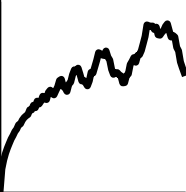
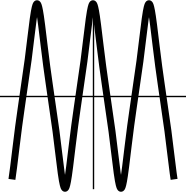
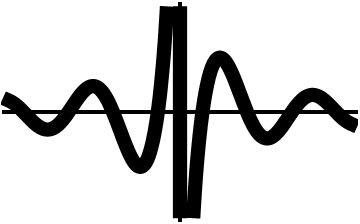
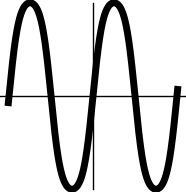
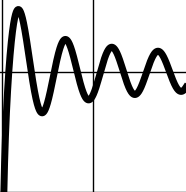
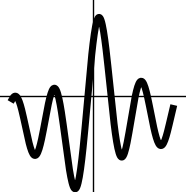
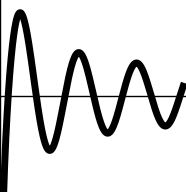
| 01:22, 6 July 2016 | Riemannglyph.png (file) |  |
6 KB | Tom | Category:riemannglyph <pre>#!/usr/bin/python import numpy as np import matplotlib.pyplot as plt from mpmath import * from pylab import rcParams rcParams['figure.figsize'] = 2.4,2.4 def riemann(x): return nsum(lambda k: sin((k**2)*x)/(k**2)... | 1 |
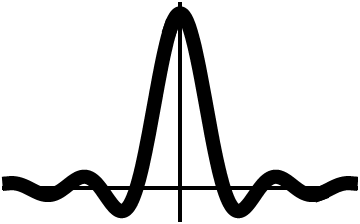
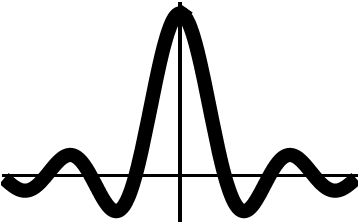
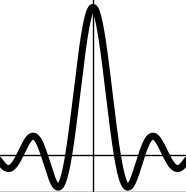
| 04:32, 21 August 2015 | Jincthumb.png (file) |  |
6 KB | Tom | Plot[Jinc[x], {x, -15, 15}, PlotStyle -> {Thickness[0.04], Black}, AxesStyle -> Thickness[0.01], Ticks -> None] | 1 |
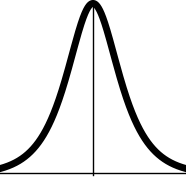
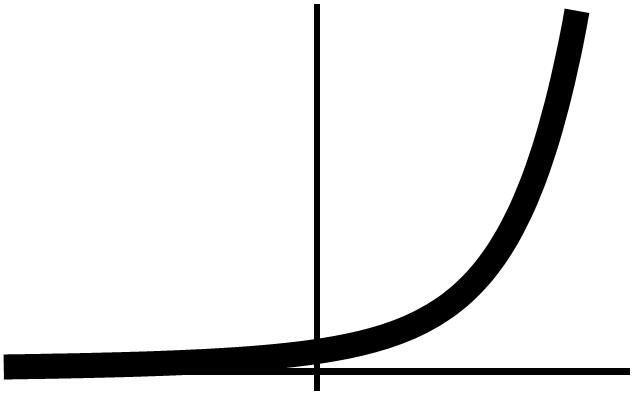
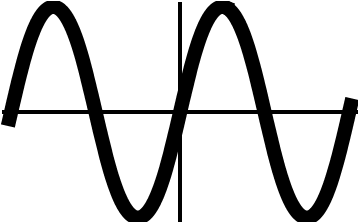
| 20:38, 14 May 2016 | Sechglyph.png (file) |  |
6 KB | Tom | Category:Sechglyph <pre>#!/usr/bin/python import numpy as np import matplotlib.pyplot as plt from mpmath import * from pylab import rcParams rcParams['figure.figsize'] = 2.4,2.4 x=np.arange(-4,4,0.00001) f=np.vectorize(sech) y=f(x) fig, ax = plt.... | 1 |
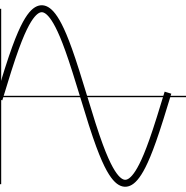
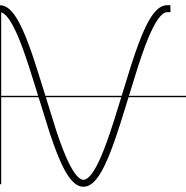
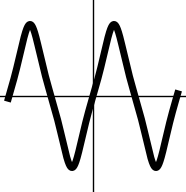
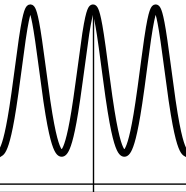
| 17:55, 29 January 2016 | Sineglyph.png (file) |  |
6 KB | Tom | <pre> #!/usr/bin/python import numpy as np import matplotlib.pyplot as plt from mpmath import * from pylab import rcParams rcParams['figure.figsize'] = 2.4,2.4 x=np.arange(0,2*pi,0.00001) f=np.vectorize(sin) y=f(x) fig, ax = plt.subplots() plt.ylim([... | 1 |
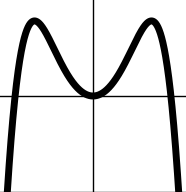
| 20:24, 9 July 2016 | Kelvinbei,n=0glyph.png (file) |  |
6 KB | Tom | Category:kelvinbeiglyph <pre>#!/usr/bin/python import numpy as np import matplotlib.pyplot as plt from mpmath import * from pylab import rcParams rcParams['figure.figsize'] = 2.4,2.4 x=np.arange(-6,6,0.01) f=np.vectorize(lambda x: bei(0,x)) y=f(x)... | 1 |
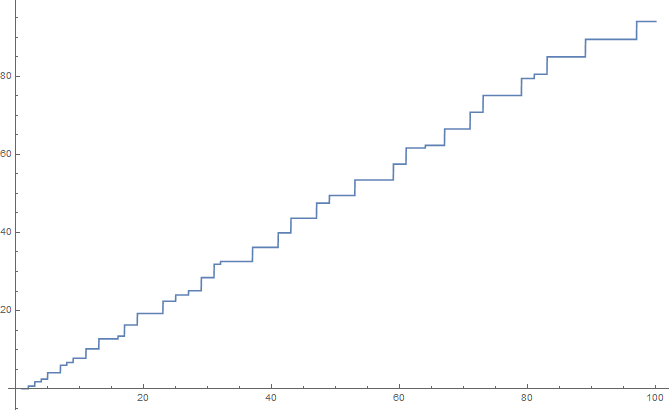
| 04:58, 4 September 2015 | Chebyshevpsiplotto100.png (file) |  |
6 KB | Tom | Reverted to version as of 04:02, 4 September 2015 | 3 |
| 17:57, 29 January 2016 | Cosineglyph.png (file) |  |
6 KB | Tom | <pre> #!/usr/bin/python import numpy as np import matplotlib.pyplot as plt from mpmath import * from pylab import rcParams rcParams['figure.figsize'] = 2.4,2.4 x=np.arange(0,2*pi,0.00001) f=np.vectorize(cos) y=f(x) fig, ax = plt.subplots() plt.ylim([... | 1 |
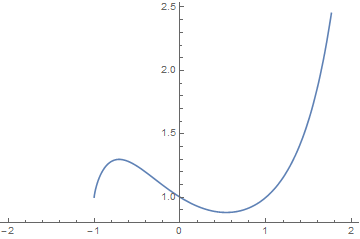
| 19:03, 25 July 2015 | Plot of hyperfactorial.png (file) |  |
6 KB | Tom | Plot[Hyperfactorial[x], {x, -2, 2}] | 1 |
| 03:07, 6 July 2016 | Takagiglyph.png (file) |  |
6 KB | Tom | Category:takagiglyph <pre>#!/usr/bin/python import numpy as np import matplotlib.pyplot as plt from mpmath import * from pylab import rcParams rcParams['figure.figsize'] = 2.4,2.4 def distfnc(x): return min(x-floor(x),ceil(x)-x) def takag... | 1 |
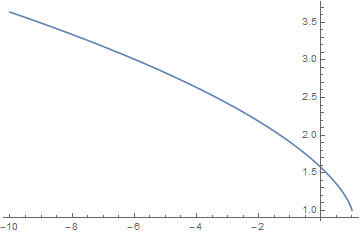
| 18:05, 25 July 2015 | Elliptice plot.png (file) |  |
6 KB | Tom | Plot[EllipticE[z], {z, -10, 1}] | 1 |
| 20:03, 19 May 2015 | Sphericalbesseljthumb.png (file) |  |
6 KB | Tom | Plot[SphericalBesselJ[0, x], {x, -12, 12}, PlotStyle -> {Thickness[0.04], Black}, AxesStyle -> Thickness[0.01], Ticks -> None] | 1 |
| 17:47, 9 June 2016 | Jacobicn,m=0.8glyph.png (file) |  |
6 KB | Tom | Category:Jacobicnglyph <pre>#!/usr/bin/python import numpy as np import matplotlib.pyplot as plt from mpmath import * from pylab import rcParams rcParams['figure.figsize'] = 2.4,2.4 x=np.arange(-13,13,0.001) f=np.vectorize(lambda x: ellipfun('cn',... | 2 |
| 11:52, 19 January 2015 | Eulerphithumb.png (file) |  |
6 KB | Tom | DiscretePlot[EulerPhi[k], {k, 0, 40}, PlotStyle -> {PointSize[0.03], Black}, FillingStyle -> None, AxesStyle -> Thickness[0.01], AxesStyle -> Thickness[0.01], Ticks -> None] | 1 |
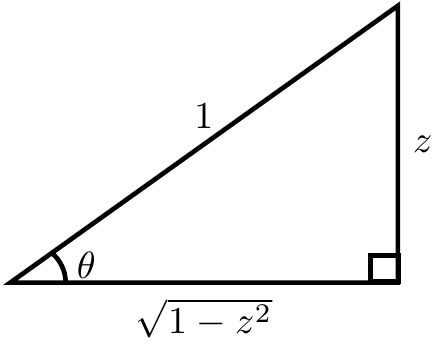
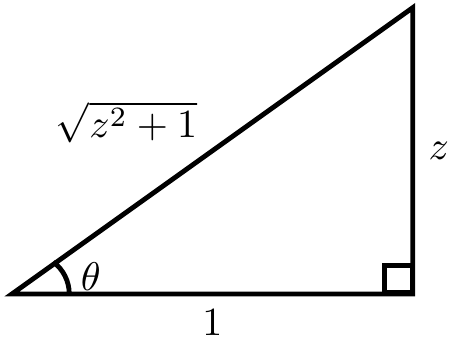
| 05:25, 31 October 2014 | Cos(arcsin(z)).png (file) | ).png) |
6 KB | Tom | 1 | |
| 12:48, 19 January 2015 | Weierstrasspthumb.png (file) |  |
6 KB | Tom | Plot[WeierstrassP[x, {1, 2}], {x, -5, 5}, PlotStyle -> {Thickness[0.04], Black}, AxesStyle -> Thickness[0.01], Ticks -> None] | 1 |
| 20:03, 19 May 2015 | Sphericalbesselythumb.png (file) |  |
6 KB | Tom | Plot[SphericalBesselY[0, x], {x, -12, 12}, PlotStyle -> {Thickness[0.04], Black}, AxesStyle -> Thickness[0.01], Ticks -> None] | 1 |
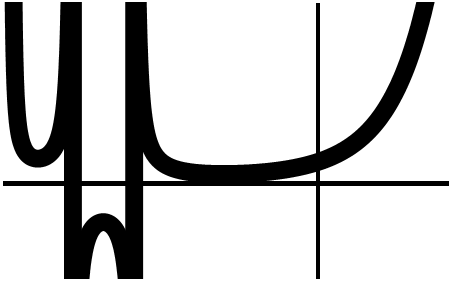
| 18:56, 9 June 2016 | Jacobisd,m=0.8glyph.png (file) |  |
6 KB | Tom | Category:jacobisdglyph <pre>#!/usr/bin/python import numpy as np import matplotlib.pyplot as plt from mpmath import * from pylab import rcParams rcParams['figure.figsize'] = 2.4,2.4 x=np.arange(-9.1,9.1,0.001) f=np.vectorize(lambda x: ellipfun('sd... | 1 |
| 13:16, 19 January 2015 | Pochhammerthumb.png (file) |  |
7 KB | Tom | Plot[Pochhammer[3, x], {x, -5, 2}, PlotStyle -> {Thickness[0.04], Black}, AxesStyle -> Thickness[0.01], Ticks -> None, PlotPoints -> 200] | 1 |
| 09:20, 19 January 2015 | Fibonaccithumb.png (file) |  |
7 KB | Tom | Plot[{Fibonacci[4, x], Fibonacci[2, x], Fibonacci[3, x]}, {x, -1, 1}, PlotStyle -> {{Thickness[0.015], Black}, {Thickness[0.015], Black}, {Thickness[0.015], Black}}, AxesStyle -> Thickness[0.01], Ticks -> None] | 1 |
| 05:38, 31 October 2014 | Sec(arctan(z)).png (file) | ).png) |
7 KB | Tom | 1 | |
| 01:14, 5 January 2017 | Sincglyph.png (file) |  |
7 KB | Tom | Category:sincglyph <pre>#!/usr/bin/python import numpy as np import matplotlib.pyplot as plt from mpmath import * from pylab import rcParams rcParams['figure.figsize'] = 2.4,2.4 x1=np.arange(-20,20,0.001) f=np.vectorize(lambda x: sin(x)/x) y1=f(x1... | 1 |
| 18:58, 9 June 2016 | Jacobisn,m=0.8glyph.png (file) |  |
7 KB | Tom | Category:jacobisnglyph <pre>#!/usr/bin/python import numpy as np import matplotlib.pyplot as plt from mpmath import * from pylab import rcParams rcParams['figure.figsize'] = 2.4,2.4 x=np.arange(-9.1,9.1,0.001) f=np.vectorize(lambda x: ellipfun('sn... | 1 |
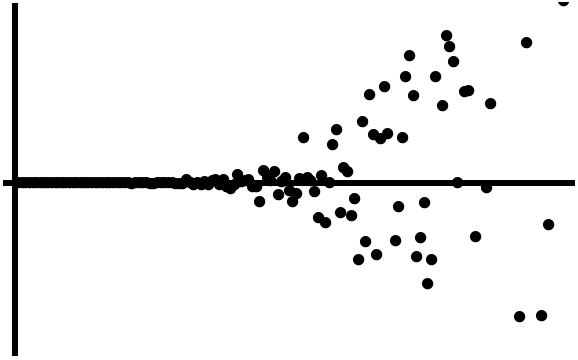
| 12:31, 19 January 2015 | Ramanujantauthumb.png (file) |  |
7 KB | Tom | DiscretePlot[RamanujanTau[k], {k, 150}, PlotStyle -> {PointSize[0.02], Black}, FillingStyle -> None, AxesStyle -> Thickness[0.01], AxesStyle -> Thickness[0.01], Ticks -> None] | 1 |
| 18:56, 25 July 2015 | Plot dirichlet beta.png (file) |  |
7 KB | Tom | Plot[DirichletBeta[s], {s, -4, 4}] | 1 |
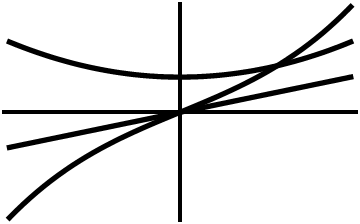
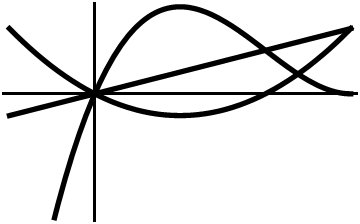
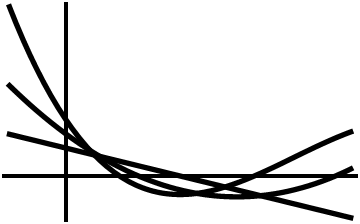
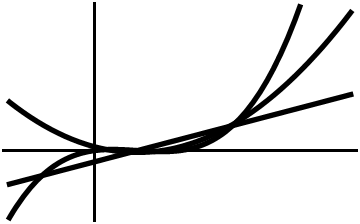
| 09:03, 19 January 2015 | Abelpolynomialthumb.png (file) |  |
7 KB | Tom | Plot[{x, -2 x + x^2, 9 x - 6 x^2 + x^3}, {x, -1, 3}, PlotStyle -> {{Thickness[0.015], Black}, {Thickness[0.015], Black}, {Thickness[0.015], Black}}, AxesStyle -> Thickness[0.01], Ticks -> None] | 1 |
| 21:20, 10 June 2016 | Bessely,n=1glyph.png (file) |  |
7 KB | Tom | Category:Besselyglyph <pre>#!/usr/bin/python import numpy as np import matplotlib.pyplot as plt from mpmath import * from pylab import rcParams rcParams['figure.figsize'] = 2.4,2.4 x=np.arange(0.1,25,0.01) x2=np.arange(-25,25,0.1) f=np.vectorize(... | 1 |
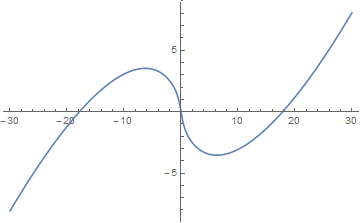
| 19:43, 25 July 2015 | Plot riemann siegel theta.png (file) |  |
7 KB | Tom | Plot[RiemannSiegelTheta[z], {z, -30, 30}] | 1 |
| 21:18, 10 June 2016 | Bessely,n=0glyph.png (file) |  |
7 KB | Tom | Category:Besselyglyph <pre>#!/usr/bin/python import numpy as np import matplotlib.pyplot as plt from mpmath import * from pylab import rcParams rcParams['figure.figsize'] = 2.4,2.4 x=np.arange(0.1,25,0.01) x2=np.arange(-25,25,0.1) f=np.vectorize(... | 1 |
| 17:43, 31 December 2015 | Scorerhithumb.png (file) |  |
7 KB | Tom | Plot[ScorerHi[x], {x, -3, 3}, PlotStyle -> {Thickness[0.04], Black}, AxesStyle -> Thickness[0.01], Ticks -> None] | 1 |
| 08:53, 19 January 2015 | Associatedlaguerrelthumb.png (file) |  |
7 KB | Tom | Plot[{LaguerreL[1, 1, x], LaguerreL[2, 1, x], LaguerreL[3, 1, x]}, {x, -1, 5}, PlotStyle -> {{Thickness[0.015], Black}, {Thickness[0.015], Black}, {Thickness[0.015], Black}}, AxesStyle -> Thickness[0.01], Ticks -> None] | 1 |
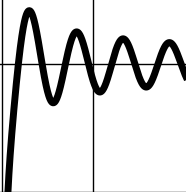
| 10:54, 19 January 2015 | Devilstaircasethumb.png (file) |  |
7 KB | Tom | f[x_, w_] := x + w + (0.2) Sin[2 Pi x] h[w_] := Nest[f[#, w] &, .1, 1000] data = Table[{w, h[w]}, {w, 0, 1, .005}]; ListPlot[data, Joined -> True, PlotRange -> All, PlotStyle -> {Thickness[0.025], Black}, AxesStyle -> Thickness[0.01], Ticks -> None] | 1 |
| 12:59, 19 January 2015 | Jacobisdthumb.png (file) |  |
7 KB | Tom | Plot[JacobiSD[x, 1/3], {x, -7, 7}, PlotStyle -> {Thickness[0.04], Black}, AxesStyle -> Thickness[0.01], Ticks -> None] | 1 |
| 16:51, 23 May 2016 | Anger0glyph.png (file) |  |
7 KB | Tom | Category:Angerglyph <pre>#!/usr/bin/python import numpy as np import matplotlib.pyplot as plt from mpmath import * from pylab import rcParams rcParams['figure.figsize'] = 2.4,2.4 def angerintegrand(t,n,x): return cos(n*t-x*sin(t)) def ange... | 1 |
| 17:49, 9 June 2016 | Jacobicd,m=0.8glyph.png (file) |  |
7 KB | Tom | Category:Jacobicdglyph <pre>#!/usr/bin/python import numpy as np import matplotlib.pyplot as plt from mpmath import * from pylab import rcParams rcParams['figure.figsize'] = 2.4,2.4 x=np.arange(-13,13,0.001) f=np.vectorize(lambda x: ellipfun('cd',... | 2 |
| 13:00, 19 January 2015 | Jacobisnthumb.png (file) |  |
7 KB | Tom | Plot[JacobiSN[x, 1/3], {x, -7, 7}, PlotStyle -> {Thickness[0.04], Black}, AxesStyle -> Thickness[0.01], Ticks -> None] | 1 |
| 16:54, 23 May 2016 | Anger0.5glyph.png (file) |  |
7 KB | Tom | Category:Angerglyph <pre>#!/usr/bin/python import numpy as np import matplotlib.pyplot as plt from mpmath import * from pylab import rcParams rcParams['figure.figsize'] = 2.4,2.4 def angerintegrand(t,n,x): return cos(n*t-x*sin(t)) def ange... | 1 |
| 01:49, 5 January 2017 | Versineglyph.png (file) |  |
7 KB | Tom | Category:versineglyph <pre>#!/usr/bin/python import numpy as np import matplotlib.pyplot as plt from mpmath import * from pylab import rcParams rcParams['figure.figsize'] = 2.4,2.4 x1=np.arange(-20,20,0.001) f=np.vectorize(lambda x: 1-cos(x)) y1=f... | 2 |
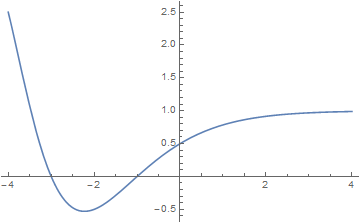
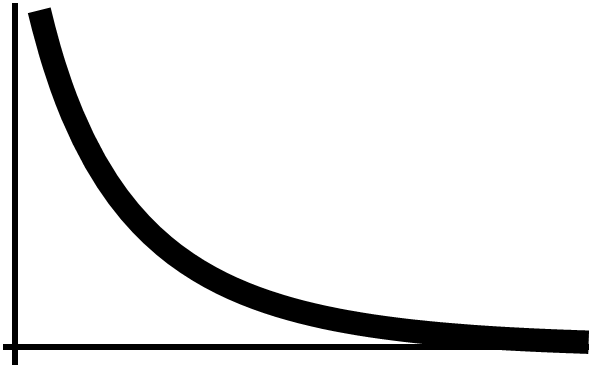
| 22:15, 16 August 2015 | Expintegralethumb.png (file) |  |
7 KB | Tom | Plot[ExpIntegralE[2, x], {x, 0, 3}, PlotStyle -> {Thickness[0.04], Black}, AxesStyle -> Thickness[0.01], Ticks -> None] | 1 |
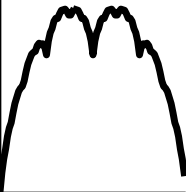
| 21:09, 5 July 2016 | Darbouxglyph.png (file) |  |
7 KB | Tom | Category:darbouxglyph <pre>#!/usr/bin/python import numpy as np import matplotlib.pyplot as plt from mpmath import * from pylab import rcParams rcParams['figure.figsize'] = 2.4,2.4 def distfnc(x): return min(x-floor(x),ceil(x)-x) def fabe... | 4 |
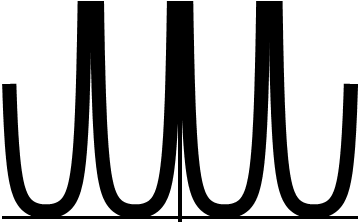
| 05:24, 10 January 2017 | Jacobitheta1,q=0.5glyph.png (file) |  |
7 KB | Tom | Category:Jacobitheta1glyph <pre>#!/usr/bin/python import numpy as np import matplotlib.pyplot as plt from mpmath import * from pylab import rcParams rcParams['figure.figsize'] = 2.4,2.4 x1=np.arange(-10,10,0.001) f=np.vectorize(lambda x: jtheta(1,... | 1 |
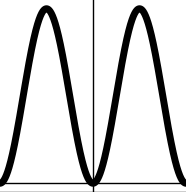
| 05:27, 10 January 2017 | Jacobitheta2,q=0.5glyph.png (file) |  |
7 KB | Tom | Category:Jacobitheta2 <pre>#!/usr/bin/python import numpy as np import matplotlib.pyplot as plt from mpmath import * from pylab import rcParams rcParams['figure.figsize'] = 2.4,2.4 x1=np.arange(-10,10,0.001) f=np.vectorize(lambda x: jtheta(2,x,0.5... | 1 |
| 02:29, 5 January 2017 | Covercosineglyph.png (file) |  |
7 KB | Tom | Category:covercosineglyph <pre>#!/usr/bin/python import numpy as np import matplotlib.pyplot as plt from mpmath import * from pylab import rcParams rcParams['figure.figsize'] = 2.4,2.4 x1=np.arange(-20,20,0.001) f=np.vectorize(lambda x: 1+sin(x))... | 1 |
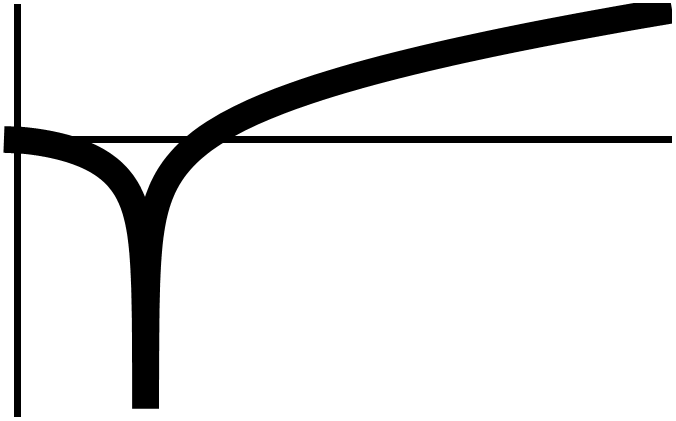
| 07:36, 19 January 2015 | Lithumb.png (file) |  |
7 KB | Tom | Plot[LogIntegral[x], {x, 0, 5}, PlotStyle -> {Thickness[0.04], Black}, AxesStyle -> Thickness[0.01], Ticks -> None] | 1 |
| 18:11, 9 June 2016 | Jacobidn,m=0.8glyph.png (file) |  |
7 KB | Tom | Category:Jacobidnglyph <pre>#!/usr/bin/python import numpy as np import matplotlib.pyplot as plt from mpmath import * from pylab import rcParams rcParams['figure.figsize'] = 2.4,2.4 x=np.arange(-6.7,6.7,0.001) f=np.vectorize(lambda x: ellipfun('dn... | 1 |
| 23:13, 10 June 2016 | Sphericalbessely,n=0glyph.png (file) |  |
7 KB | Tom | Category:Sphericalbessely <pre>#!/usr/bin/python import numpy as np import matplotlib.pyplot as plt from mpmath import * from pylab import rcParams rcParams['figure.figsize'] = 2.4,2.4 def sphericalbessely(n,z): return ((pi/(2*z))**(1/2))*... | 1 |
| 08:58, 19 January 2015 | Bernoullibthumb.png (file) |  |
7 KB | Tom | Plot[{BernoulliB[1, x], BernoulliB[2, x], BernoulliB[3, x]}, {x, -1, 3}, PlotStyle -> {{Thickness[0.015], Black}, {Thickness[0.015], Black}, {Thickness[0.015], Black}}, AxesStyle -> Thickness[0.01], Ticks -> None] | 1 |
| 18:46, 9 June 2016 | Jacobind,m=0.8glyph.png (file) |  |
7 KB | Tom | Category:Jacobindglyph <pre>#!/usr/bin/python import numpy as np import matplotlib.pyplot as plt from mpmath import * from pylab import rcParams rcParams['figure.figsize'] = 2.4,2.4 x=np.arange(-7.1,7.1,0.001) f=np.vectorize(lambda x: ellipfun('nd... | 1 |
| 01:51, 5 January 2017 | Coversinglyph.png (file) |  |
7 KB | Tom | Category:coversineglyph <pre>#!/usr/bin/python import numpy as np import matplotlib.pyplot as plt from mpmath import * from pylab import rcParams rcParams['figure.figsize'] = 2.4,2.4 x1=np.arange(-20,20,0.001) f=np.vectorize(lambda x: 1-sin(x)) y1... | 1 |
First page |
Previous page |
Next page |
Last page |