File list
This special page shows all uploaded files.
First page |
Previous page |
Next page |
Last page |
| Date | Name | Thumbnail | Size | User | Description | Versions |
|---|---|---|---|---|---|---|
| 02:35, 26 February 2016 | Arctangentglyph.png (file) |  |
4 KB | Tom | Category:Arctangentglyph <pre>#!/usr/bin/python import numpy as np import matplotlib.pyplot as plt from mpmath import * from pylab import rcParams rcParams['figure.figsize'] = 2.4,2.4 x=np.arange(-10,10,0.00001) f=np.vectorize(atan) y=f(x) fig, a... | 1 |
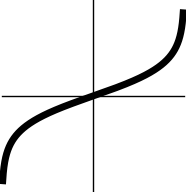
| 18:43, 15 May 2016 | Arctanhglyph.png (file) |  |
4 KB | Tom | Category:Arctanhglyph <pre>#!/usr/bin/python import numpy as np import matplotlib.pyplot as plt from mpmath import * from pylab import rcParams rcParams['figure.figsize'] = 2.4,2.4 x=np.arange(-0.99,0.99,0.001) f=np.vectorize(atanh) y=f(x) fig, a... | 1 |
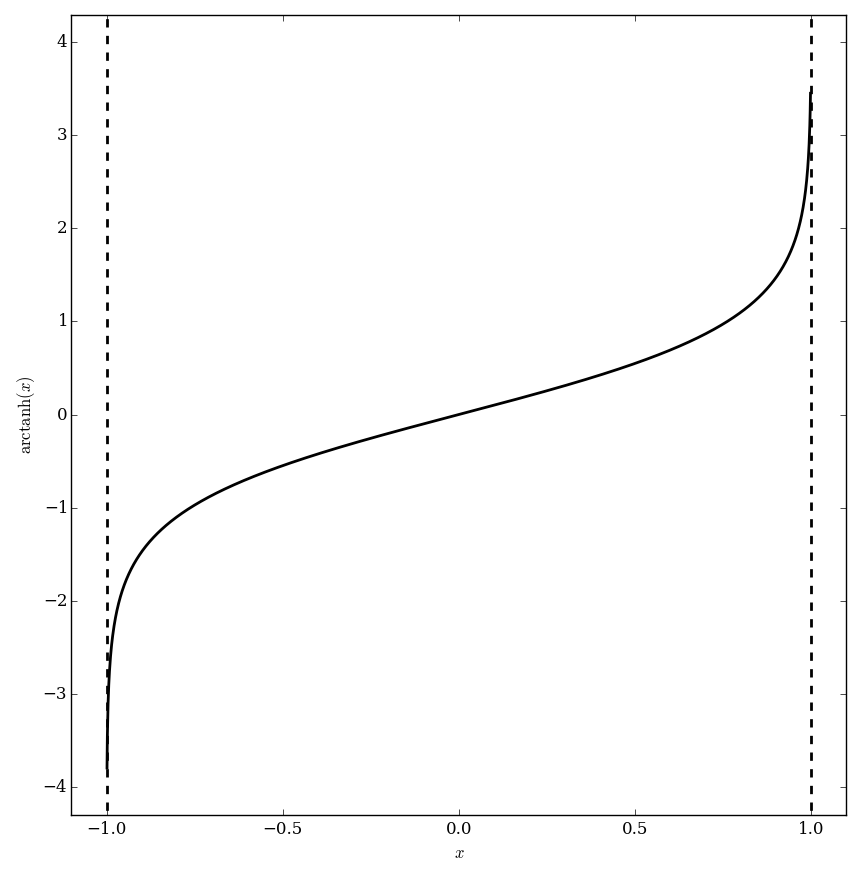
| 00:42, 16 September 2016 | Arctanhplot.png (file) |  |
29 KB | Tom | Category:Plot <pre> #!/usr/bin/python import numpy as np import matplotlib.pyplot as plt from mpmath import * from pylab import rcParams rcParams['figure.figsize'] = 10, 10 x=np.arange(-0.999,0.999,0.001); f=np.vectorize(atanh) y=f(x) def g(x):... | 2 |
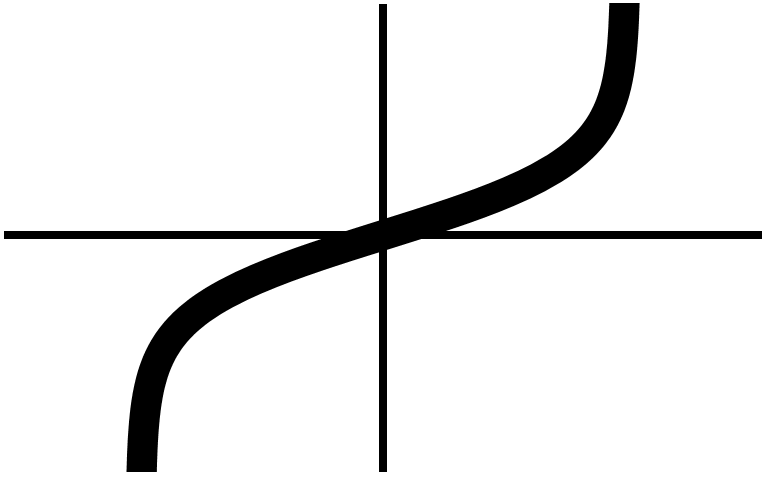
| 04:47, 19 January 2015 | Arctanhthumb.png (file) |  |
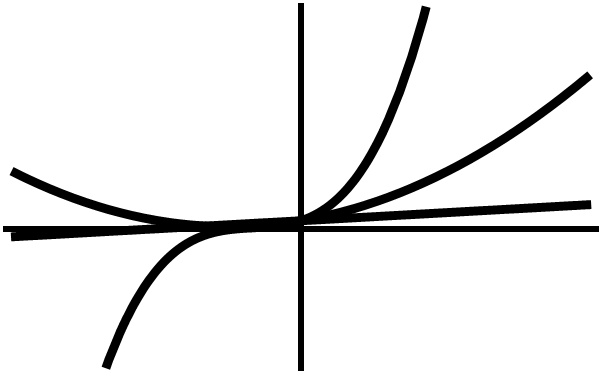
9 KB | Tom | Plot[ArcTanh[x], {x, -1.5, 1.5}, PlotStyle -> {Thickness[0.04], Black}, AxesStyle -> Thickness[0.01], Ticks -> None] | 1 |
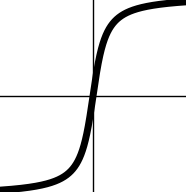
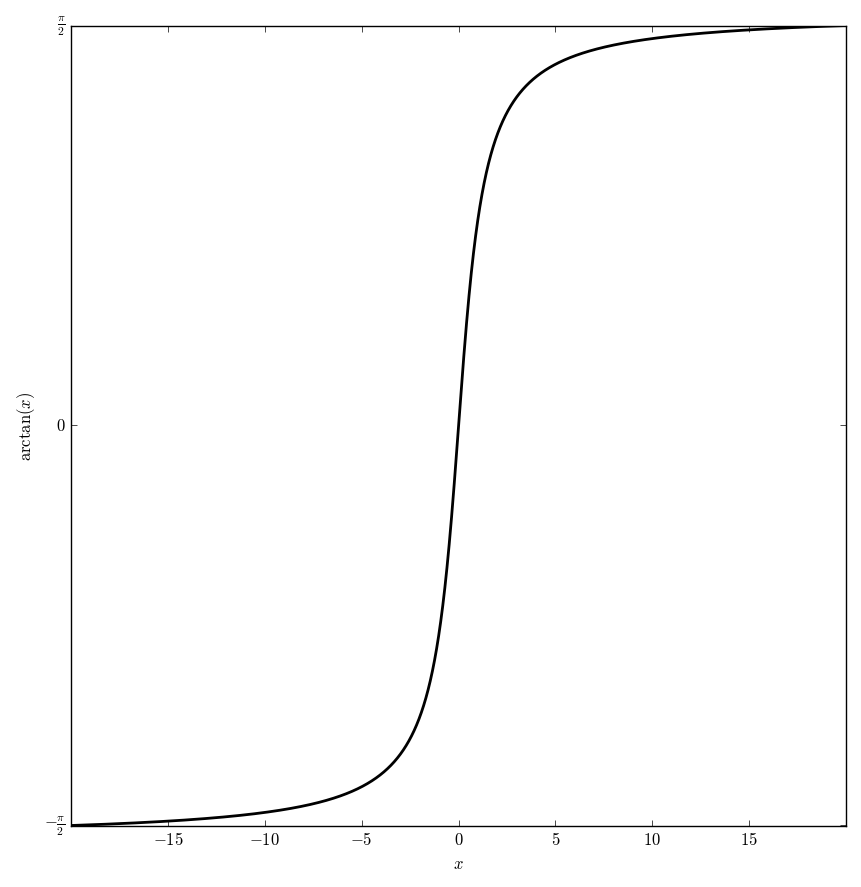
| 04:13, 16 May 2016 | Arctanplot.png (file) |  |
22 KB | Tom | Category:Plot <pre>#!/usr/bin/python import numpy as np import matplotlib.pyplot as plt from mpmath import * from pylab import rcParams rcParams['figure.figsize'] = 10, 10 x=np.arange(-20,20,0.0001); f=np.vectorize(atan) y=f(x) fig, ax = plt.subp... | 1 |
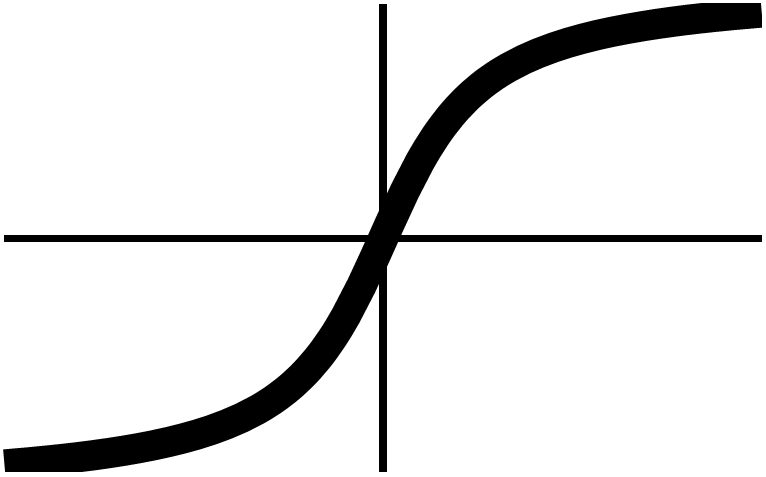
| 04:05, 19 January 2015 | Arctanthumb.png (file) |  |
10 KB | Tom | Plot[ArcTan[x], {x, -5, 5}, PlotStyle -> {Thickness[0.04], Black}, AxesStyle -> Thickness[0.01], Ticks -> None] | 1 |
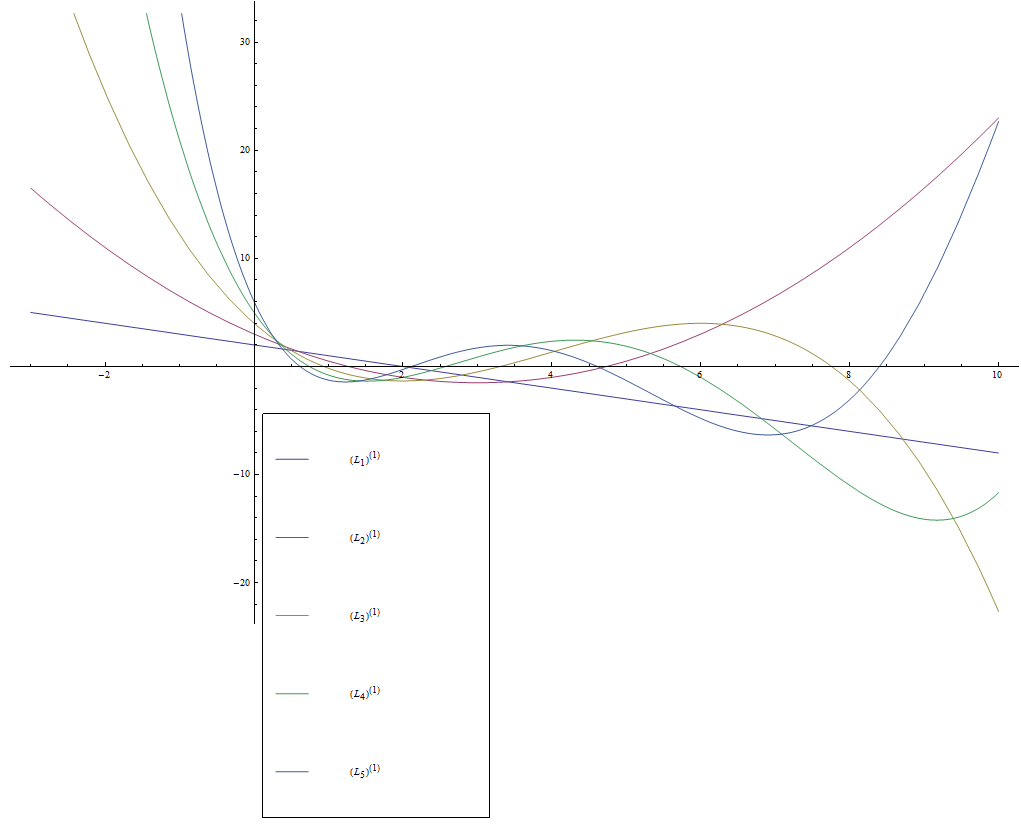
| 15:31, 24 October 2014 | Associatedlaguerrealpha=1.png (file) |  |
44 KB | Tom | Plot[{LaguerreL[1, 1, x], LaguerreL[2, 1, x], LaguerreL[3, 1, x], LaguerreL[4, 1, x], LaguerreL[5, 1, x]}, {x, -3, 10}, PlotLegend -> {Superscript[Subscript[L, 1], "(1)"], Superscript[Subscript[L, 2], "(1)"], Superscript[Subscript[L, 3], "... | 1 |
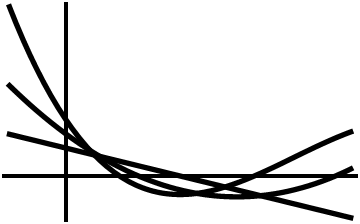
| 08:53, 19 January 2015 | Associatedlaguerrelthumb.png (file) |  |
7 KB | Tom | Plot[{LaguerreL[1, 1, x], LaguerreL[2, 1, x], LaguerreL[3, 1, x]}, {x, -1, 5}, PlotStyle -> {{Thickness[0.015], Black}, {Thickness[0.015], Black}, {Thickness[0.015], Black}}, AxesStyle -> Thickness[0.01], Ticks -> None] | 1 |
| 18:05, 3 June 2016 | Barnesgglyph.png (file) |  |
5 KB | Tom | Category:barnesgglyph <pre>#!/usr/bin/python import numpy as np import matplotlib.pyplot as plt from mpmath import * from pylab import rcParams rcParams['figure.figsize'] = 2.4,2.4 x=np.arange(-4,3,0.1) x2=np.arange(-0.5,2,1) f=np.vectorize(barnes... | 1 |
| 00:40, 24 May 2016 | Barnesgplot.png (file) |  |
27 KB | Tom | Category:Plot <pre>#!/usr/bin/python import numpy as np import matplotlib.pyplot as plt from mpmath import * from pylab import rcParams rcParams['figure.figsize'] = 10, 10 x=np.arange(-5,5,0.01); f=np.vectorize(barnesg) y=f(x) fig, ax = plt.subpl... | 1 |
| 12:17, 19 January 2015 | Barnesgthumb.png (file) |  |
10 KB | Tom | Plot[BarnesG[x], {x, -4, 3}, PlotStyle -> {Thickness[0.04], Black}, AxesStyle -> Thickness[0.01], Ticks -> None, PlotRange -> {-1/4, 1.2}] | 1 |
| 08:49, 19 January 2015 | Batemanpolynomialthumb.png (file) |  |
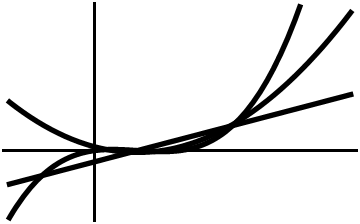
11 KB | Tom | Plot[{-x, 1/4 + (3/4) x^2, (-7/12) x - (5/12) x^3}, {x, -2, 2}, PlotStyle -> {{Thickness[0.015], Black}, {Thickness[0.015], Black}, {Thickness[0.015], Black}}, AxesStyle -> Thickness[0.01], Ticks -> None] | 1 |
| 08:58, 19 January 2015 | Bernoullibthumb.png (file) |  |
7 KB | Tom | Plot[{BernoulliB[1, x], BernoulliB[2, x], BernoulliB[3, x]}, {x, -1, 3}, PlotStyle -> {{Thickness[0.015], Black}, {Thickness[0.015], Black}, {Thickness[0.015], Black}}, AxesStyle -> Thickness[0.01], Ticks -> None] | 1 |
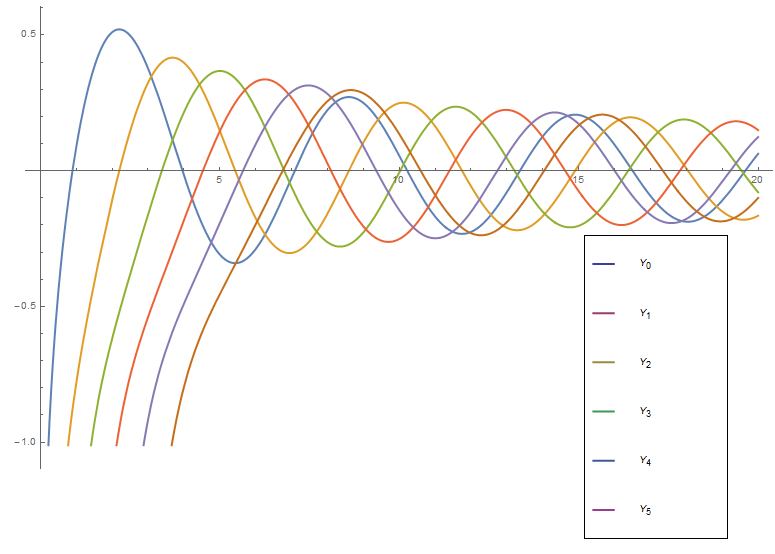
| 23:30, 19 May 2015 | Bessel y plot.png (file) |  |
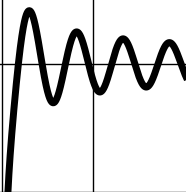
73 KB | Tom | Plot[{BesselY[0, x], BesselY[1, x], BesselY[2, x], BesselY[3, x], BesselY[4, x], BesselY[5, x]}, {x, 0, 20}, PlotStyle -> {Thick, Thick}, PlotLegend -> {Subscript[Y, 0], Subscript[Y, 1], Subscript[Y, 2], Subscript[Y, 3], Subscript[Y, 4], Sub... | 1 |
| 16:18, 29 April 2017 | Besselcliffordglyph.png (file) |  |
4 KB | Tom | Category:besselcliffordglyph <pre>#!/usr/bin/python import numpy as np import matplotlib.pyplot as plt from mpmath import * from pylab import rcParams rcParams['figure.figsize'] = 2.4,2.4 def besselclifford(n,z): return nsum(lambda k: z**k... | 1 |
| 16:03, 29 April 2017 | Besselcliffordn=0plot.png (file) |  |
30 KB | Tom | Category:Plot <pre>#!/usr/bin/python import numpy as np import matplotlib.pyplot as plt from mpmath import * from pylab import rcParams rcParams['figure.figsize'] = 10, 10 def besselclifford(n,z): return nsum(lambda k: z**k/(gamma(k+n+1)*... | 1 |
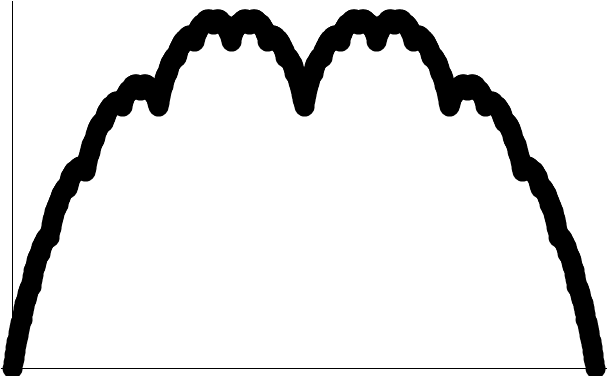
| 21:26, 10 June 2016 | Besseli,n=0glyph.png (file) |  |
6 KB | Tom | Category:Besseliglyph <pre>#!/usr/bin/python import numpy as np import matplotlib.pyplot as plt from mpmath import * from pylab import rcParams rcParams['figure.figsize'] = 2.4,2.4 x=np.arange(-3,3,0.01) x2=np.arange(-25,25,0.1) f=np.vectorize(la... | 3 |
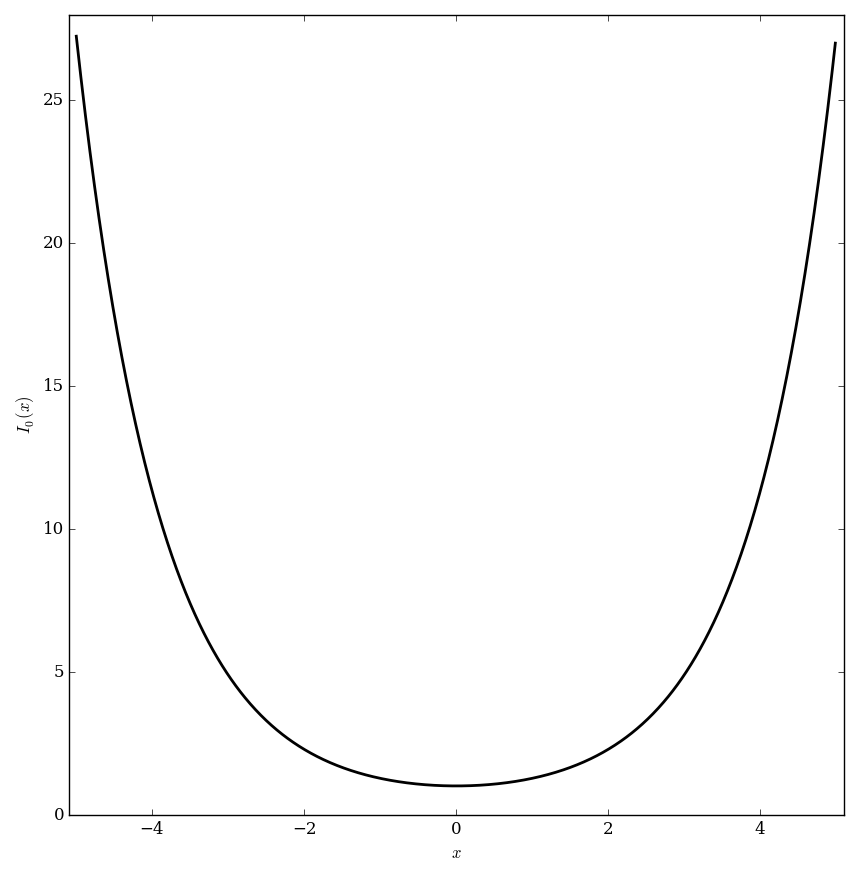
| 23:51, 10 June 2016 | Besseli,n=0plot.png (file) |  |
32 KB | Tom | Category:Plot <pre>#!/usr/bin/python import numpy as np import matplotlib.pyplot as plt from mpmath import * from pylab import rcParams rcParams['figure.figsize'] = 10, 10 x=np.arange(-5,5,0.01); f=np.vectorize(lambda x: besseli(0,x)) y=f(x) fig... | 1 |
| 21:31, 10 June 2016 | Besseli,n=1glyph.png (file) |  |
5 KB | Tom | Category:Besseliglyph <pre>#!/usr/bin/python import numpy as np import matplotlib.pyplot as plt from mpmath import * from pylab import rcParams rcParams['figure.figsize'] = 2.4,2.4 x=np.arange(-4,4,0.01) x2=np.arange(-25,25,0.1) f=np.vectorize(la... | 1 |
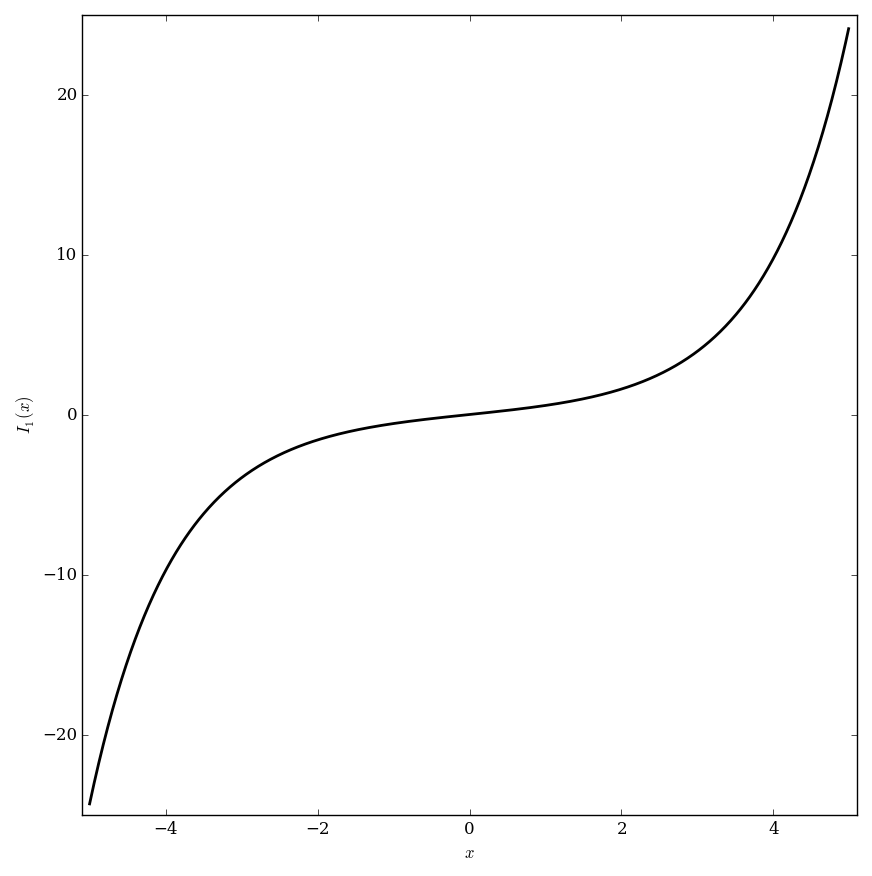
| 23:52, 10 June 2016 | Besseli,n=1plot.png (file) |  |
27 KB | Tom | Category:Plot <pre>#!/usr/bin/python import numpy as np import matplotlib.pyplot as plt from mpmath import * from pylab import rcParams rcParams['figure.figsize'] = 10, 10 x=np.arange(-5,5,0.01); f=np.vectorize(lambda x: besseli(1,x)) y=f(x) fig... | 1 |
| 06:19, 18 May 2015 | Besselithumb.png (file) |  |
9 KB | Tom | Plot[BesselI[2, x], {x, -5, 5}, PlotStyle -> {Thickness[0.04], Black}, AxesStyle -> Thickness[0.01], Ticks -> None] | 1 |
| 21:08, 10 June 2016 | Besselj,n=0glyph.png (file) |  |
8 KB | Tom | Category:Besseljglyph <pre>#!/usr/bin/python import numpy as np import matplotlib.pyplot as plt from mpmath import * from pylab import rcParams rcParams['figure.figsize'] = 2.4,2.4 x=np.arange(-15,15,0.1) x2=np.arange(-15,15,0.1) f=np.vectorize(l... | 1 |
| 21:12, 10 June 2016 | Besselj,n=1glyph.png (file) |  |
8 KB | Tom | Category:Besseljglyph <pre>#!/usr/bin/python import numpy as np import matplotlib.pyplot as plt from mpmath import * from pylab import rcParams rcParams['figure.figsize'] = 2.4,2.4 x=np.arange(-15,15,0.1) x2=np.arange(-15,15,0.1) f=np.vectorize(l... | 1 |
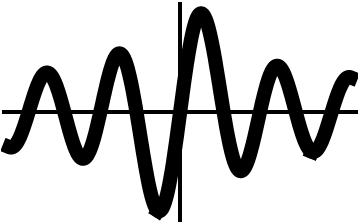
| 06:35, 19 January 2015 | Besselj0thumb.png (file) |  |
18 KB | Tom | Plot[BesselJ[0, x], {x, -15, 15}, PlotStyle -> {Thickness[0.04], Black}, AxesStyle -> Thickness[0.01], Ticks -> None] | 1 |
| 00:07, 7 September 2015 | Besselj1thumb.png (file) |  |
9 KB | Tom | Plot[BesselJ[1, x], {x, -15, 15}, PlotStyle -> {Thickness[0.04], Black}, AxesStyle -> Thickness[0.01], Ticks -> None] Category:BesselJThumb | 1 |
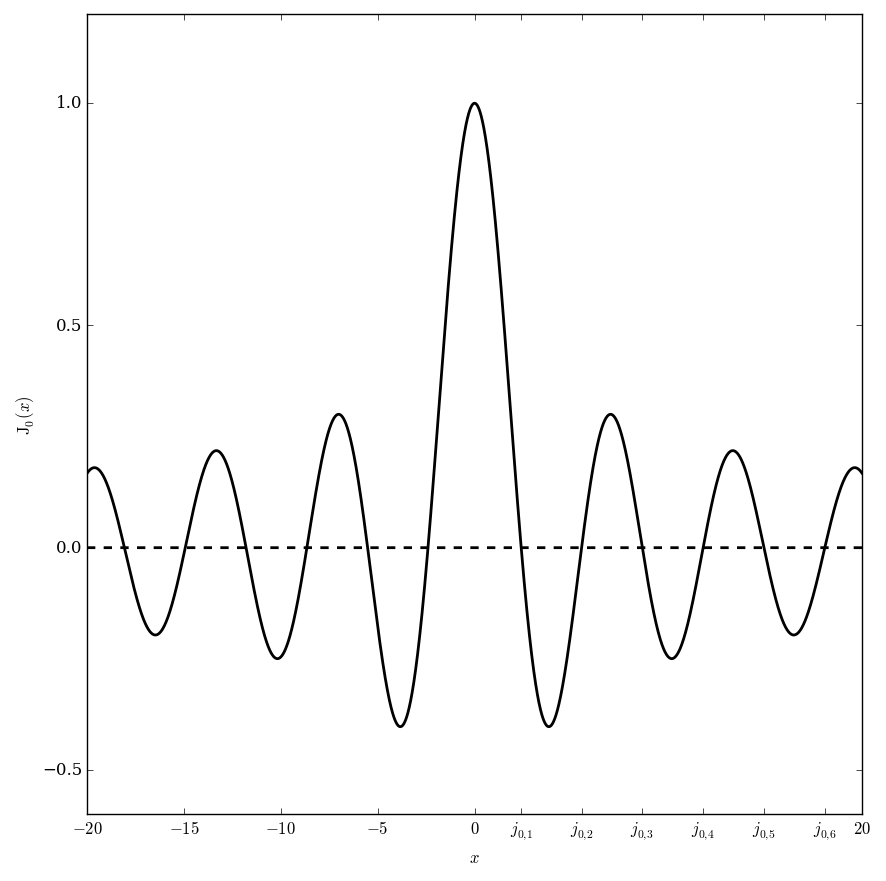
| 06:20, 24 May 2016 | Besseljn=0plot.png (file) |  |
46 KB | Tom | Category:Plot <pre>#!/usr/bin/python import numpy as np import matplotlib.pyplot as plt from mpmath import * from pylab import rcParams rcParams['figure.figsize'] = 10, 10 x=np.arange(-20,20,0.01); def f(x): return besselj(0,x) g=np.vector... | 1 |
| 22:12, 10 June 2016 | Besselk,n=0glyph.png (file) |  |
3 KB | Tom | Category:Besselkglyph <pre>#!/usr/bin/python import numpy as np import matplotlib.pyplot as plt from mpmath import * from pylab import rcParams rcParams['figure.figsize'] = 2.4,2.4 x=np.arange(0.1,4,0.01) x2=np.arange(-25,25,0.1) f=np.vectorize(l... | 2 |
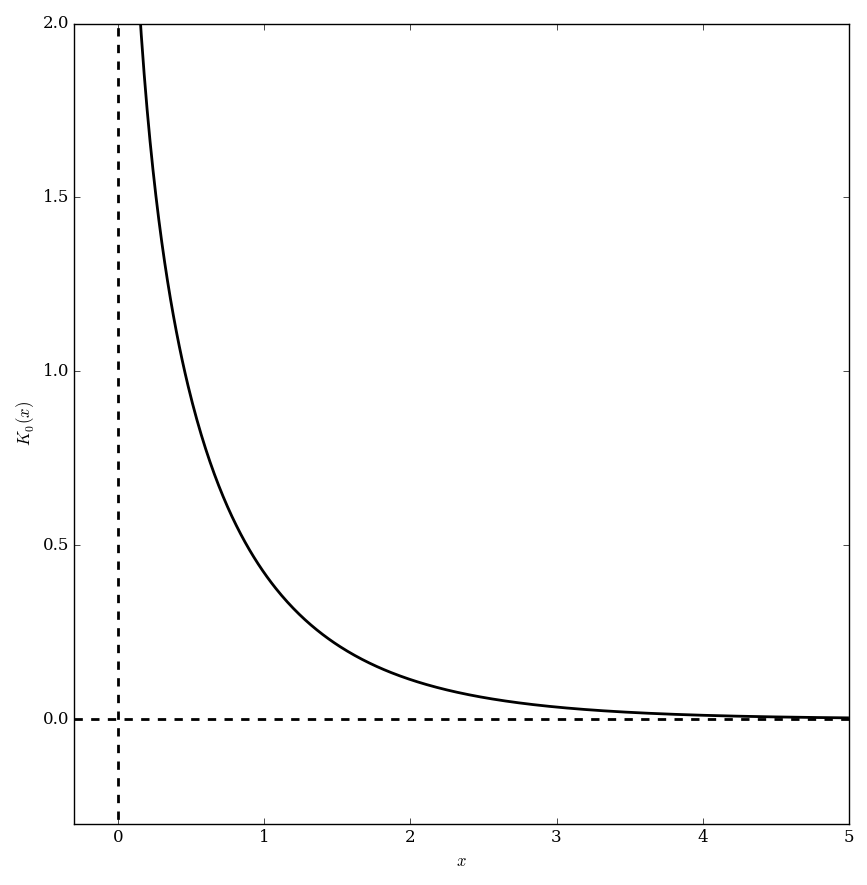
| 23:45, 10 June 2016 | Besselk,n=0plot.png (file) |  |
27 KB | Tom | Category:Plot <pre>#!/usr/bin/python import numpy as np import matplotlib.pyplot as plt from mpmath import * from pylab import rcParams rcParams['figure.figsize'] = 10, 10 x=np.arange(0.01,5,0.01); x2=np.arange(-15,15,0.1); j0=np.vectorize(lambda... | 1 |
| 09:07, 19 January 2015 | Besselpolynomialsthumb.png (file) |  |
11 KB | Tom | Plot[{x + 1, 3 x^2 + 3 x + 1, 15 x^3 + 15 x^2 + 6 x + 1}, {x, -2, 2}, PlotStyle -> {{Thickness[0.015], Black}, {Thickness[0.015], Black}, {Thickness[0.015], Black}}, AxesStyle -> Thickness[0.01], Ticks -> None] | 1 |
| 21:18, 10 June 2016 | Bessely,n=0glyph.png (file) |  |
7 KB | Tom | Category:Besselyglyph <pre>#!/usr/bin/python import numpy as np import matplotlib.pyplot as plt from mpmath import * from pylab import rcParams rcParams['figure.figsize'] = 2.4,2.4 x=np.arange(0.1,25,0.01) x2=np.arange(-25,25,0.1) f=np.vectorize(... | 1 |
| 20:44, 9 June 2016 | Bessely,n=0plot.png (file) |  |
42 KB | Tom | Category:Plot <pre>#!/usr/bin/python import numpy as np import matplotlib.pyplot as plt from mpmath import * from pylab import rcParams rcParams['figure.figsize'] = 10, 10 x=np.arange(0.01,20,0.001); f=np.vectorize(lambda x: bessely(0,x)) y=f(x)... | 1 |
| 21:20, 10 June 2016 | Bessely,n=1glyph.png (file) |  |
7 KB | Tom | Category:Besselyglyph <pre>#!/usr/bin/python import numpy as np import matplotlib.pyplot as plt from mpmath import * from pylab import rcParams rcParams['figure.figsize'] = 2.4,2.4 x=np.arange(0.1,25,0.01) x2=np.arange(-25,25,0.1) f=np.vectorize(... | 1 |
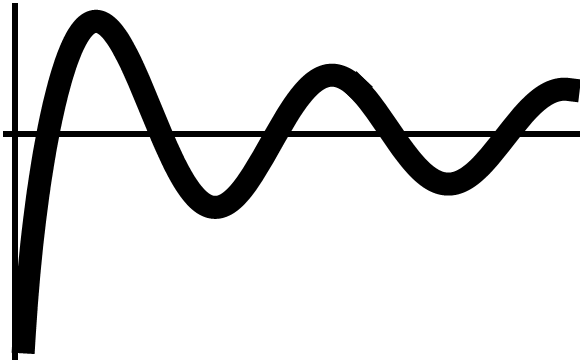
| 06:12, 18 May 2015 | Besselythumb.png (file) |  |
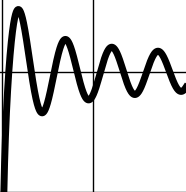
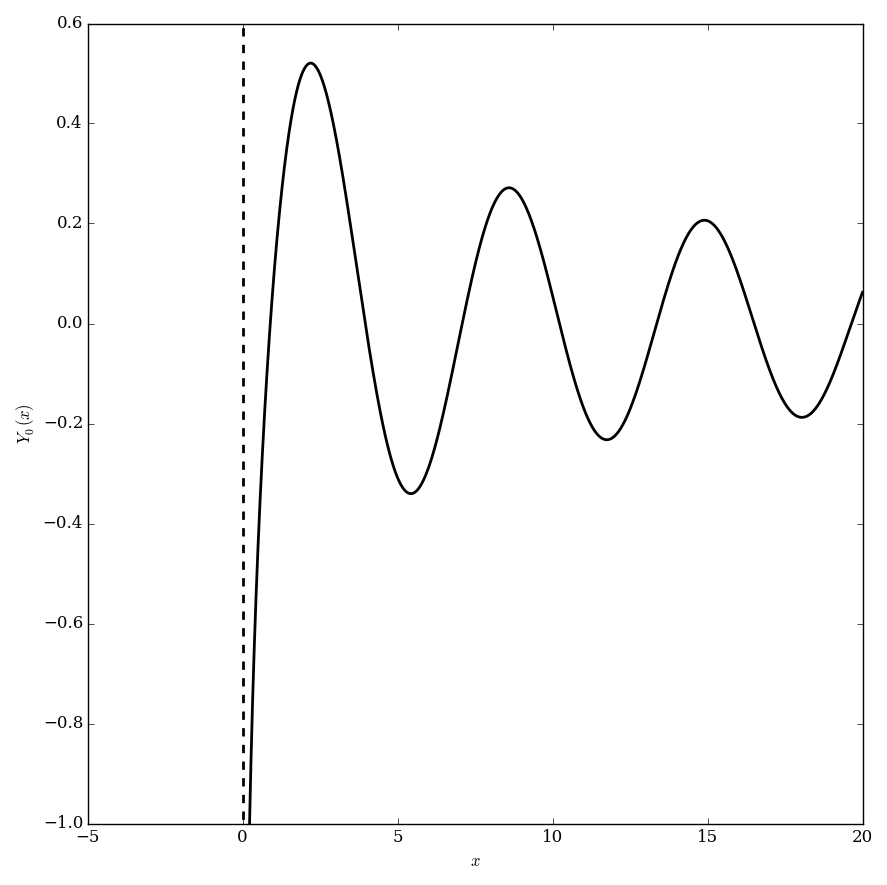
10 KB | Tom | Plot[BesselY[0, x], {x, 0, 15}, PlotStyle -> {Thickness[0.04], Black}, AxesStyle -> Thickness[0.01], Ticks -> None] | 1 |
| 17:04, 14 October 2014 | Beta.png (file) |  |
337 KB | Tom | 1 | |
| 17:04, 14 October 2014 | Beta2.png (file) |  |
106 KB | Tom | 1 | |
| 06:58, 19 January 2015 | Betathumb.png (file) |  |
49 KB | Tom | Plot3D[Beta[x, y], {x, -0.5, 2}, {y, -0.5, 2}, PlotPoints -> {200}, Ticks -> None, ColorFunction -> GrayLevel] | 1 |
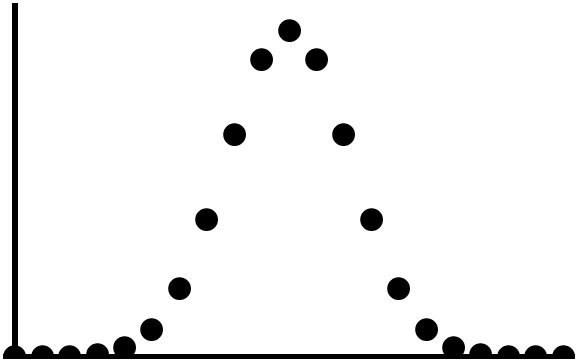
| 18:55, 25 September 2016 | Binomial,n=20glyph.png (file) |  |
2 KB | Tom | Category:binomialglyph <pre>#!/usr/bin/python import numpy as np import matplotlib.pyplot as plt from mpmath import * from pylab import rcParams rcParams['figure.figsize'] = 2.4,2.4 x=np.arange(0,20,1) f=np.vectorize(lambda x: binomial(20,x)) y=f(... | 2 |
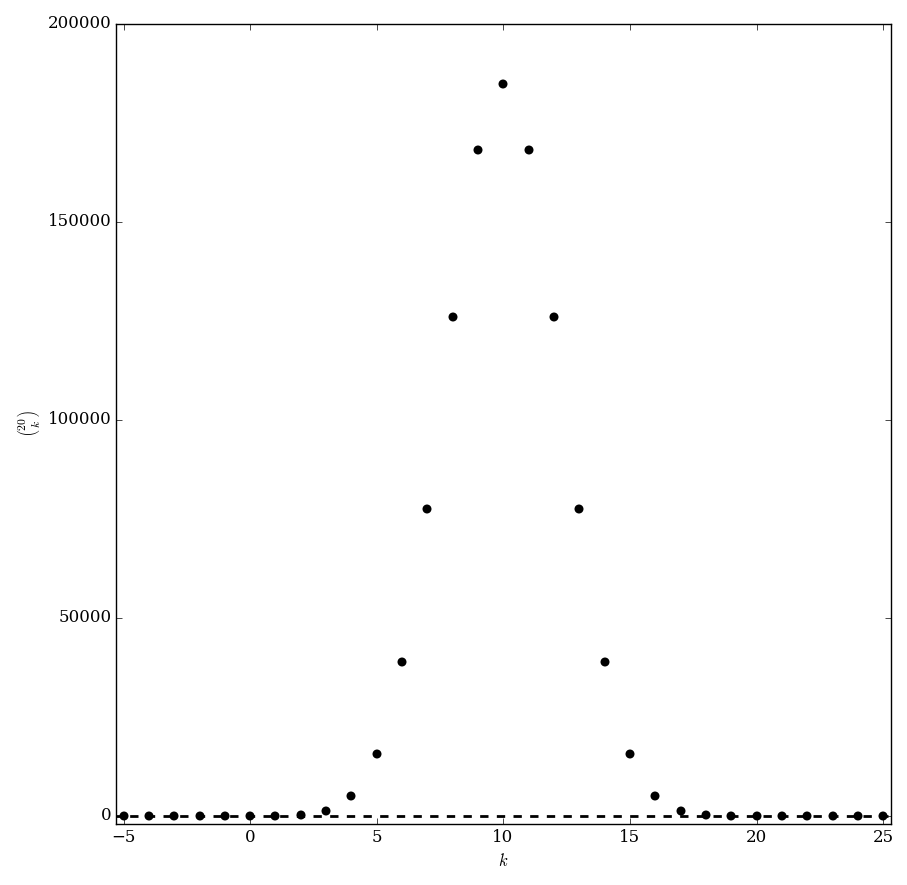
| 18:37, 25 September 2016 | Binomialcoefficient,n=20plot.png (file) |  |
18 KB | Tom | Category:Plot <pre>#!/usr/bin/python import numpy as np import matplotlib.pyplot as plt from mpmath import * from pylab import rcParams rcParams['figure.figsize'] = 10, 10 x=np.arange(-5,26,1); f=np.vectorize(lambda x: binomial(20,x)) y=f(x) g=np.... | 1 |
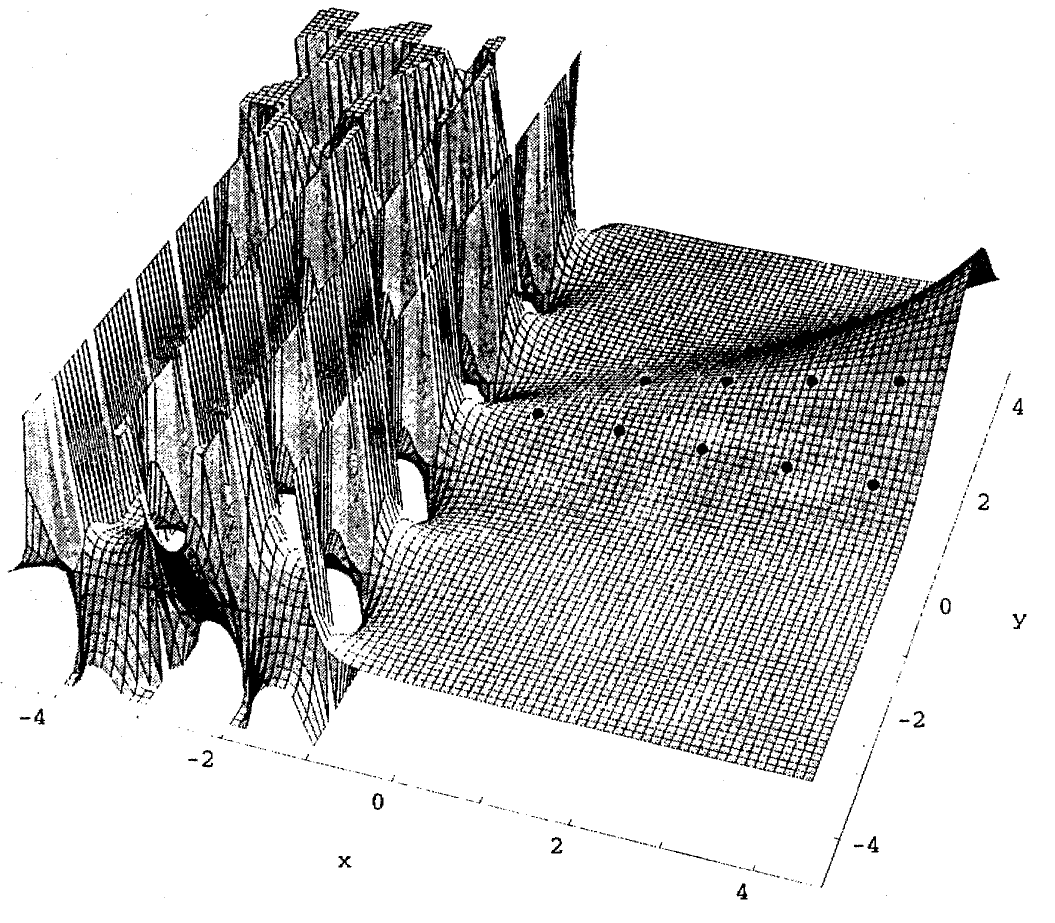
| 22:34, 13 January 2015 | Binomialcoefficientfunction.png (file) |  |
254 KB | Tom | From the paper "The Binomial Coefficient Function" by David Fowler | 1 |
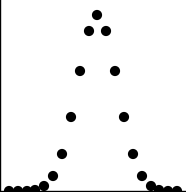
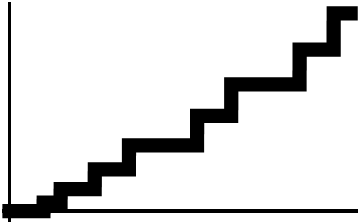
| 06:46, 19 January 2015 | Binomialthumb.png (file) |  |
5 KB | Tom | DiscretePlot[Binomial[20, k], {k, 0, 20}, PlotStyle -> {PointSize[0.04], Black}, PlotRange -> {0, 200000}, FillingStyle -> None, AxesStyle -> Thickness[0.01], AxesStyle -> Thickness[0.01], Ticks -> None] | 1 |
| 19:13, 17 May 2015 | Blancmangethumb.png (file) |  |
14 KB | Tom | b@n_ := FoldList[# + {1, #2}/2^n &, {0, 0}, Total /@ (2 Reverse[ IntegerDigits[#, 2, n] & /@ Range[0, 2^n - 1]] - 1)] ListPlot[b[10], PlotStyle -> {Automatic, AbsolutePointSize[20], Black}, AxesStyle -> Thickness[0.001], Ticks -> None] | 1 |
| 10:59, 19 January 2015 | Cantor function.gif (file) |  |
60 KB | Tom | From [http://en.wikipedia.org/wiki/Cantor_function#mediaviewer/File:Cantor_function.gif here] | 1 |
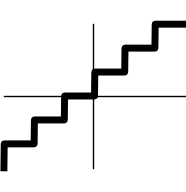
| 08:18, 16 June 2016 | Ceilingglyph.png (file) |  |
2 KB | Tom | Category:Ceilingglyph <pre>#!/usr/bin/python import numpy as np import matplotlib.pyplot as plt from mpmath import * from pylab import rcParams rcParams['figure.figsize'] = 2.4,2.4 x=np.arange(-3,3,0.01) f=np.vectorize(ceil) y=f(x) fig, ax = plt.... | 2 |
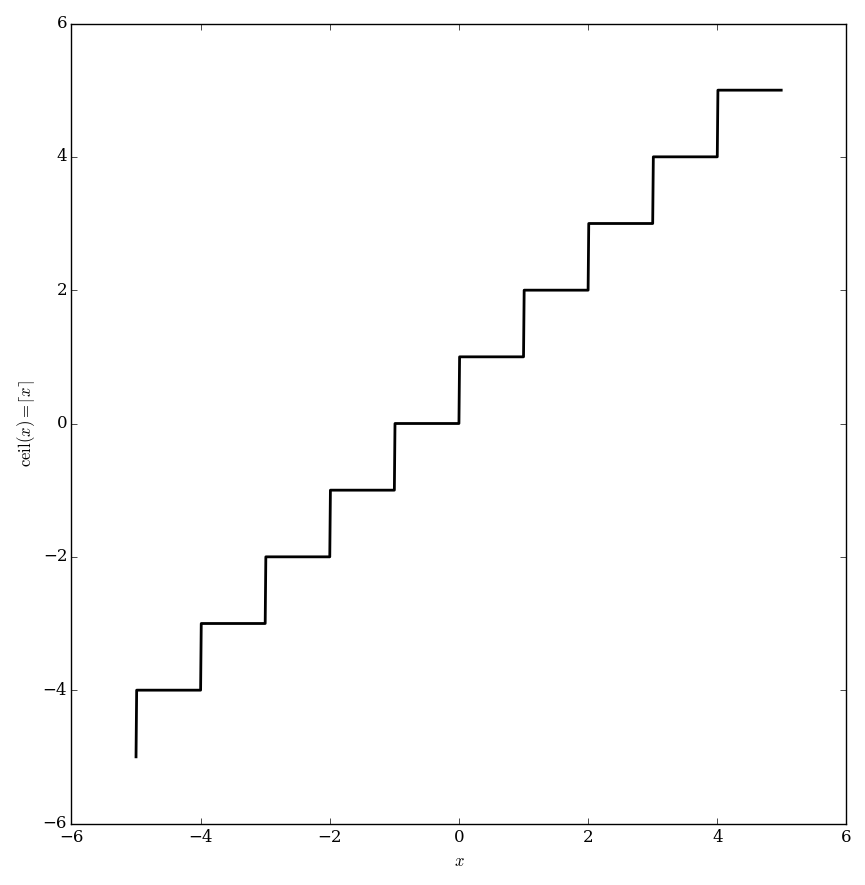
| 19:47, 3 June 2016 | Celingplot.png (file) |  |
16 KB | Tom | Category:Plot <pre>#!/usr/bin/python import numpy as np import matplotlib.pyplot as plt from mpmath import * from pylab import rcParams rcParams['figure.figsize'] = 10, 10 x=np.arange(-5,5,0.01); f=np.vectorize(ceil) y=f(x) fig, ax = plt.subplots... | 1 |
| 05:05, 4 September 2015 | Chebthetathumb.png (file) |  |
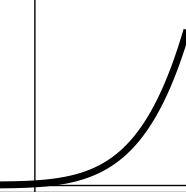
2 KB | Tom | ChebTheta[x_] := Sum[Log[Prime[k]], {k, 1, PrimePi[x]}] Export["chebthetathumb.png", Plot[ChebTheta[x], {x, 0, 20}, PlotStyle -> {Thickness[0.04], Black}, AxesStyle -> Thickness[0.01], Ticks -> None]] | 1 |
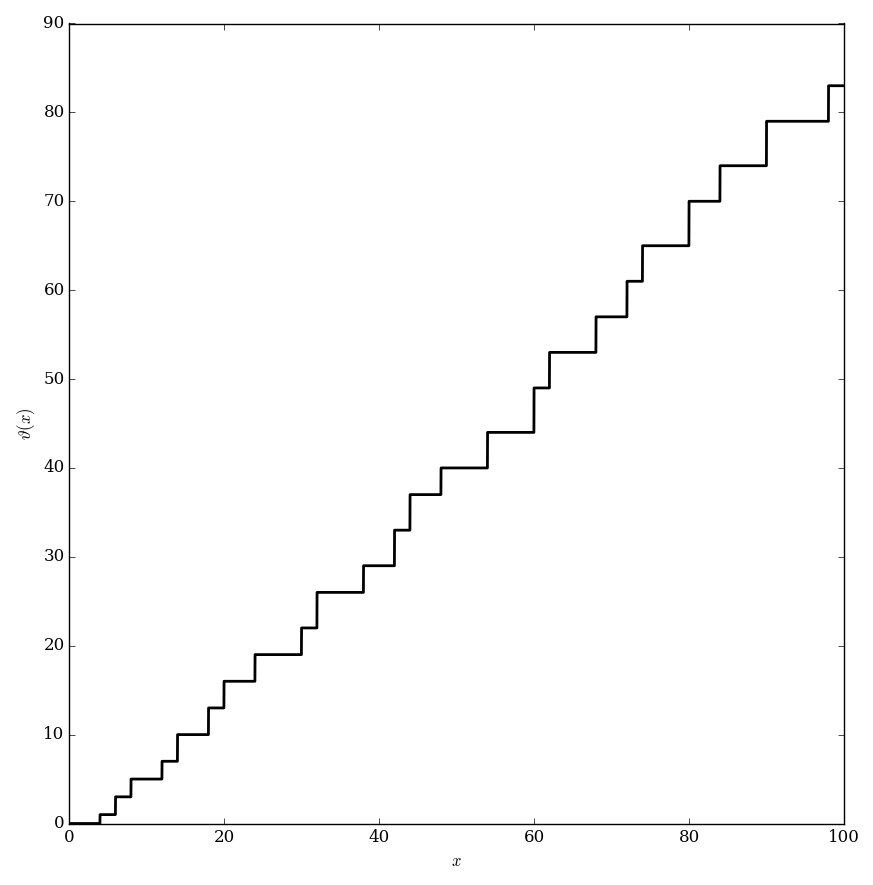
| 02:11, 28 November 2016 | Chebyshevplotfrom0to100.png (file) |  |
20 KB | Tom | Category:Plot <pre>#!/usr/bin/python import numpy as np import matplotlib.pyplot as plt from mpmath import * from pylab import rcParams rcParams['figure.figsize'] = 10, 10 def isValid(n): if (n <=0): return 0 elif... | 1 |
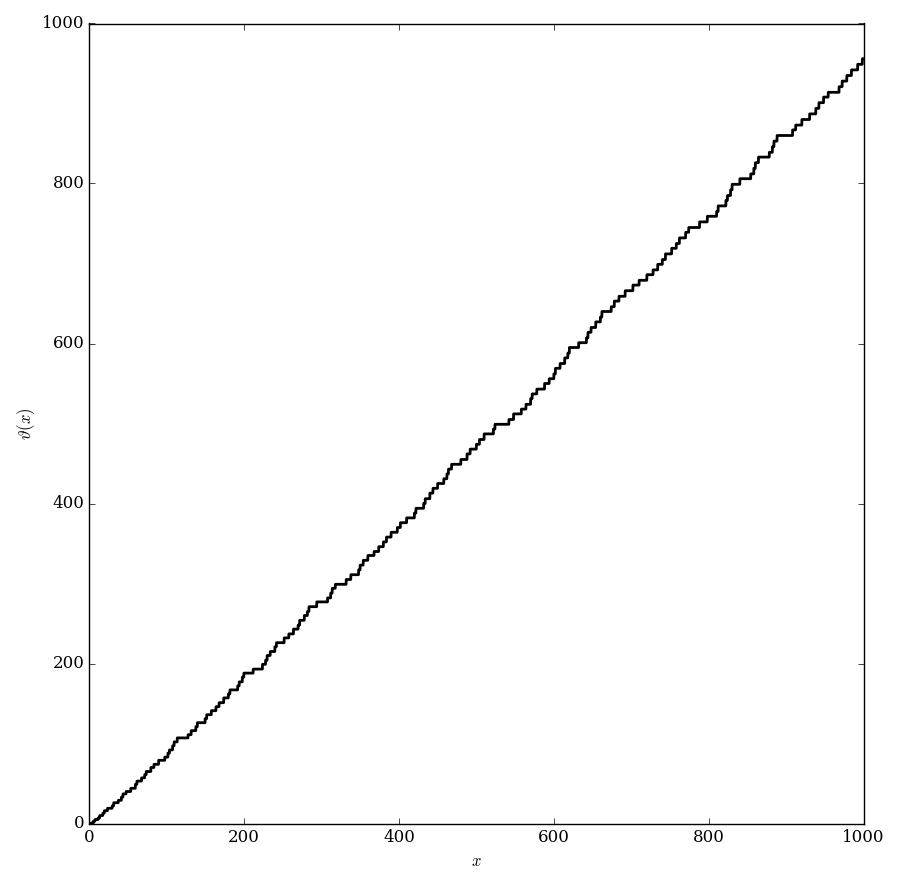
| 02:12, 28 November 2016 | Chebyshevplotfrom0to1000.png (file) |  |
29 KB | Tom | Category:Plot <pre>#!/usr/bin/python import numpy as np import matplotlib.pyplot as plt from mpmath import * from pylab import rcParams rcParams['figure.figsize'] = 10, 10 def isValid(n): if (n <=0): return 0 elif... | 1 |
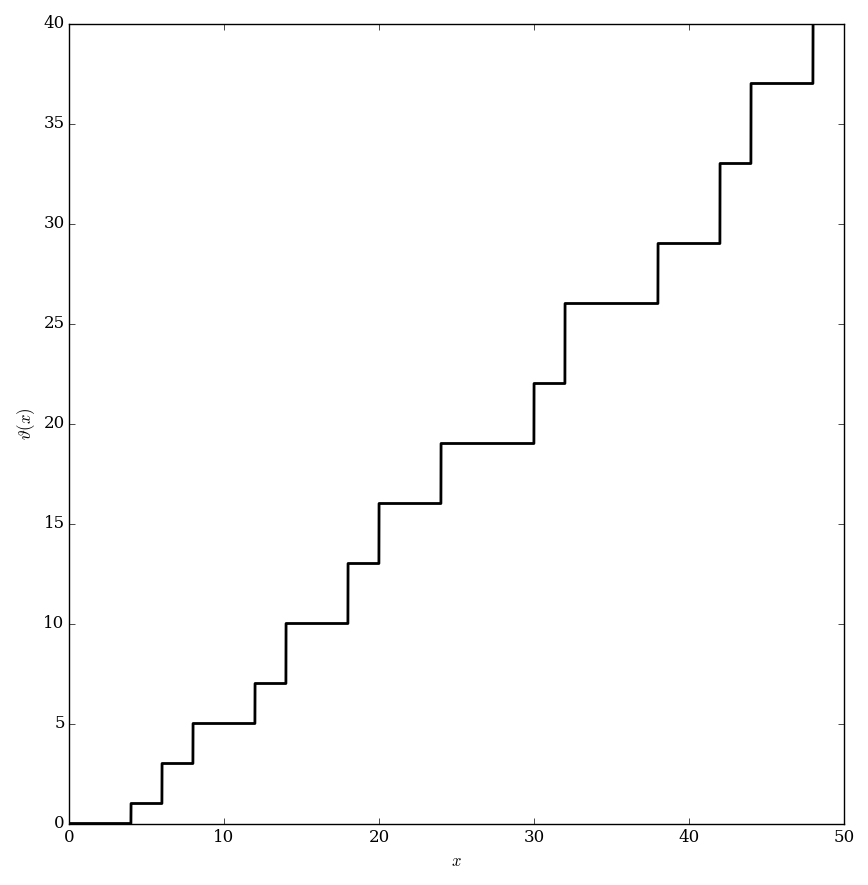
| 02:09, 28 November 2016 | Chebyshevplotfrom0to50.png (file) |  |
17 KB | Tom | Category:Plot <pre>#!/usr/bin/python import numpy as np import matplotlib.pyplot as plt from mpmath import * from pylab import rcParams rcParams['figure.figsize'] = 10, 10 def isValid(n): if (n <=0): return 0 elif... | 1 |
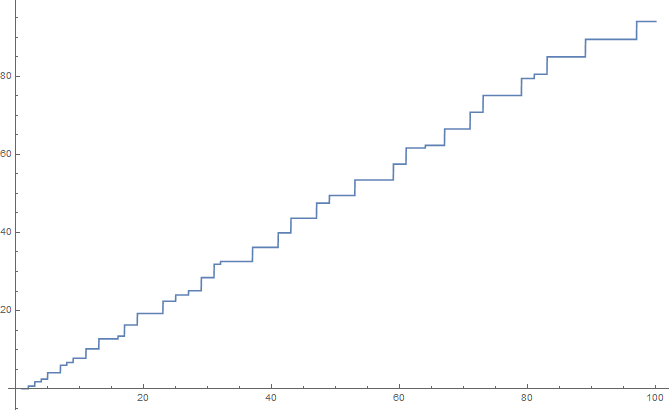
| 04:58, 4 September 2015 | Chebyshevpsiplotto100.png (file) |  |
6 KB | Tom | Reverted to version as of 04:02, 4 September 2015 | 3 |
| 04:05, 4 September 2015 | Chebyshevpsiplotto1000.png (file) |  |
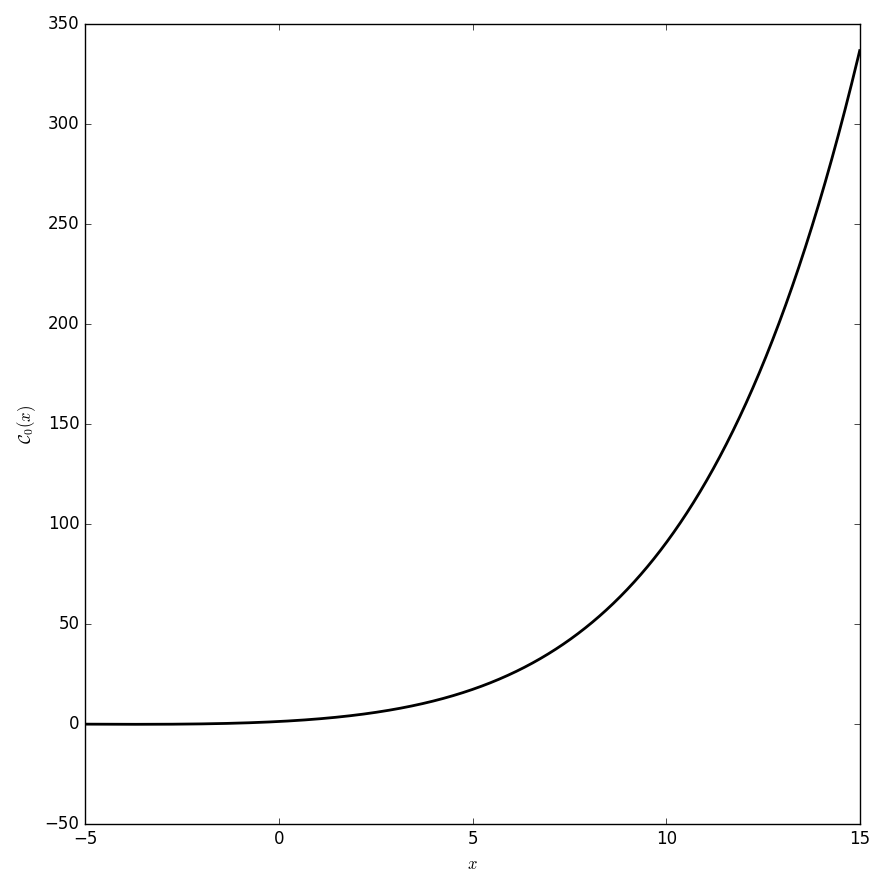
10 KB | Tom | ChebPsi[x_] := Sum[MangoldtLambda[k], {k, 1, Floor[x]}] Plot[ChebPsi[x], {x, 0, 20}, PlotStyle -> {Thickness[0.04], Black}, AxesStyle -> Thickness[0.01], Ticks -> None] | 2 |
First page |
Previous page |
Next page |
Last page |