File list
This special page shows all uploaded files.
First page |
Previous page |
Next page |
Last page |
| Date | Name | Thumbnail | Size | User | Description | Versions |
|---|---|---|---|---|---|---|
| 11:18, 19 January 2015 | Weierstrasszetathumb.png (file) |  |
9 KB | Tom | Plot[WeierstrassZeta[x, {1, 2}], {x, -3.5, 3.5}, PlotStyle -> {Thickness[0.04], Black}, AxesStyle -> Thickness[0.01], Ticks -> None] | 1 |
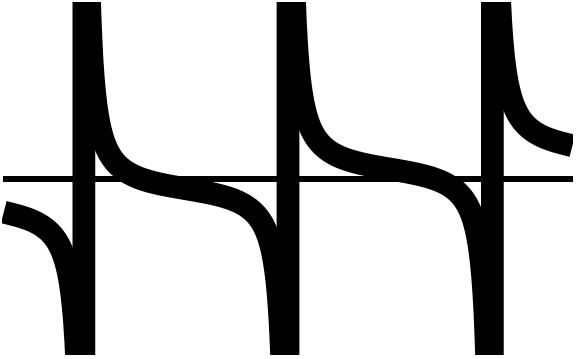
| 12:48, 19 January 2015 | Weierstrasspthumb.png (file) |  |
6 KB | Tom | Plot[WeierstrassP[x, {1, 2}], {x, -5, 5}, PlotStyle -> {Thickness[0.04], Black}, AxesStyle -> Thickness[0.01], Ticks -> None] | 1 |
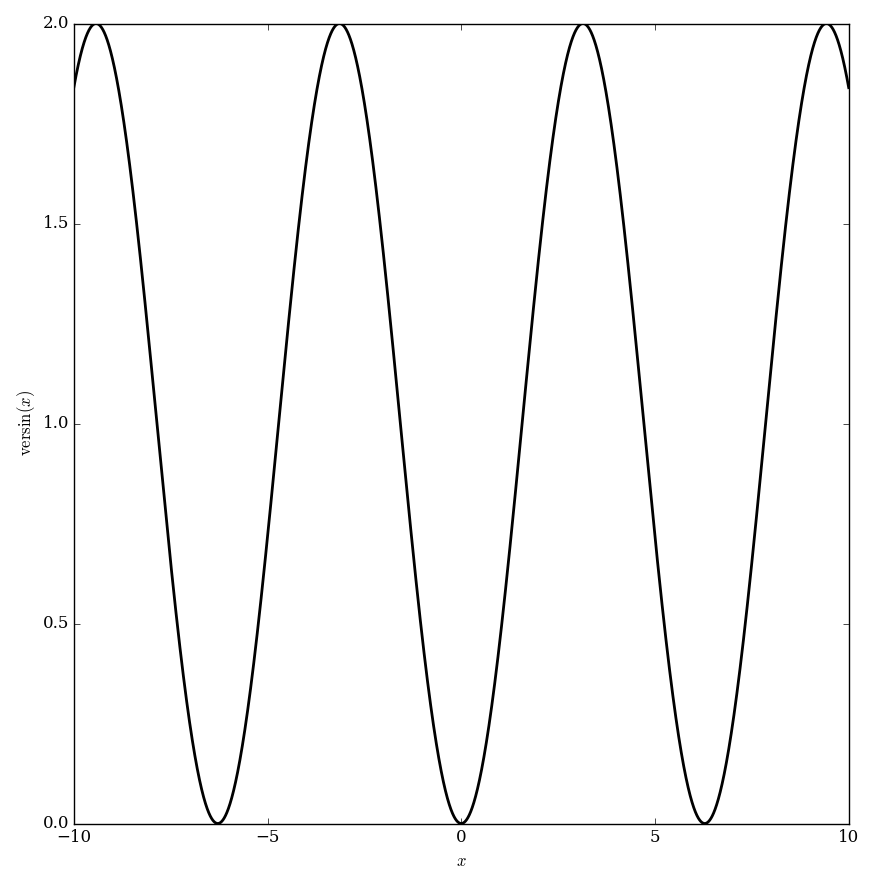
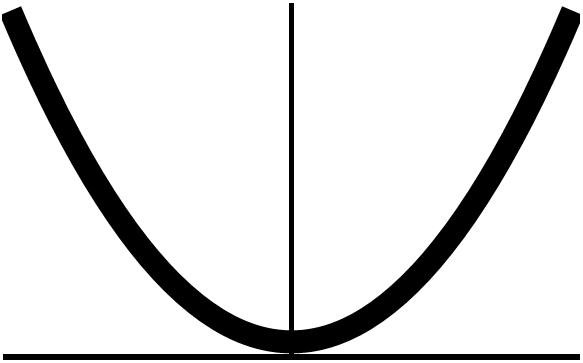
| 04:13, 4 October 2016 | Versinplot.png (file) |  |
47 KB | Tom | Category:Plot <pre> #!/usr/bin/python import numpy as np import matplotlib.pyplot as plt from mpmath import * from pylab import rcParams rcParams['figure.figsize'] = 10, 10 x=np.arange(-10,10,0.001); f=np.vectorize(lambda x: 1-cos(x)) y=f(x) fig,... | 1 |
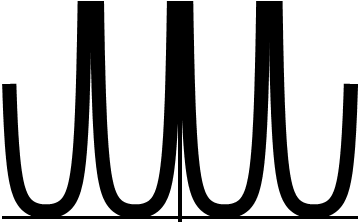
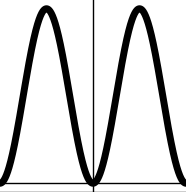
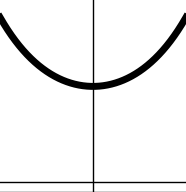
| 01:49, 5 January 2017 | Versineglyph.png (file) |  |
7 KB | Tom | Category:versineglyph <pre>#!/usr/bin/python import numpy as np import matplotlib.pyplot as plt from mpmath import * from pylab import rcParams rcParams['figure.figsize'] = 2.4,2.4 x1=np.arange(-20,20,0.001) f=np.vectorize(lambda x: 1-cos(x)) y1=f... | 2 |
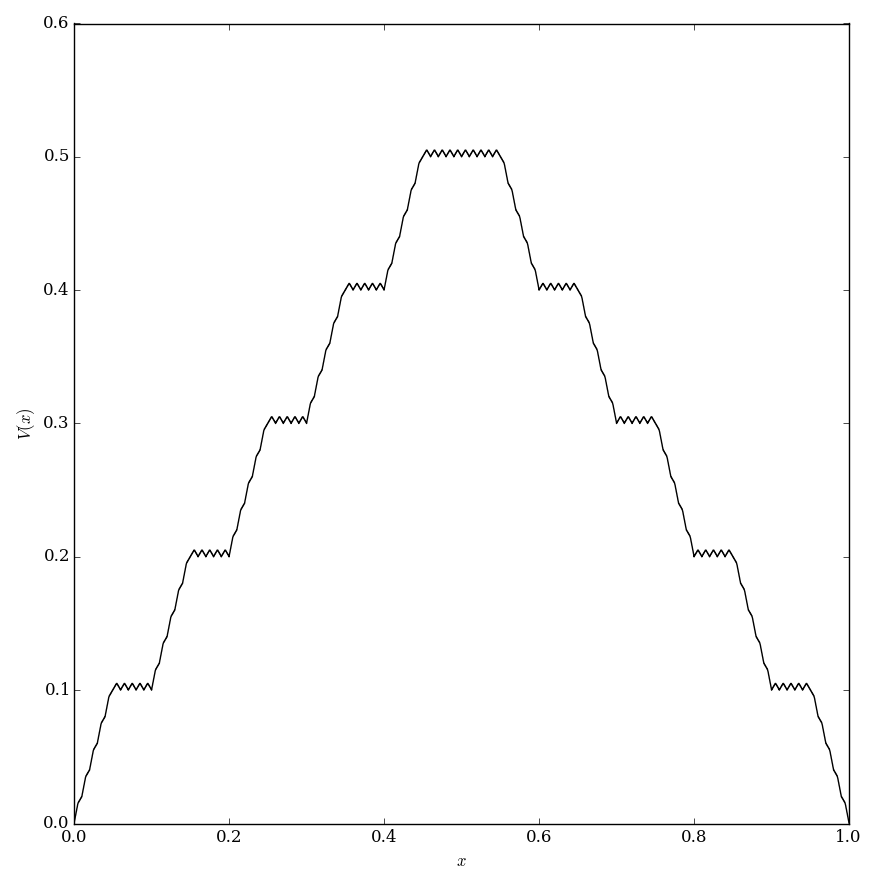
| 03:21, 6 July 2016 | Vanderwaerdenplot.png (file) |  |
35 KB | Tom | Category:Plot <pre>#!/usr/bin/python import numpy as np import matplotlib.pyplot as plt from mpmath import * from pylab import rcParams rcParams['figure.figsize'] = 10, 10 def distfnc(x): return min(x-floor(x),ceil(x)-x) def vanderwaerden... | 2 |
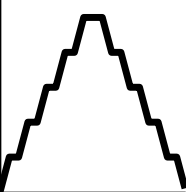
| 03:23, 6 July 2016 | Vanderwaerdenglyph.png (file) |  |
5 KB | Tom | Category:vanderwaerdenglyph <pre>#!/usr/bin/python import numpy as np import matplotlib.pyplot as plt from mpmath import * from pylab import rcParams rcParams['figure.figsize'] = 2.4,2.4 def distfnc(x): return min(x-floor(x),ceil(x)-x) de... | 1 |
| 06:12, 6 June 2016 | Trig Functions Diagram.svg (file) |  |
10 KB | Tom | [https://en.wikipedia.org/wiki/Versine#/media/File:Circle-trig6.svg from Wikipedia] | 1 |
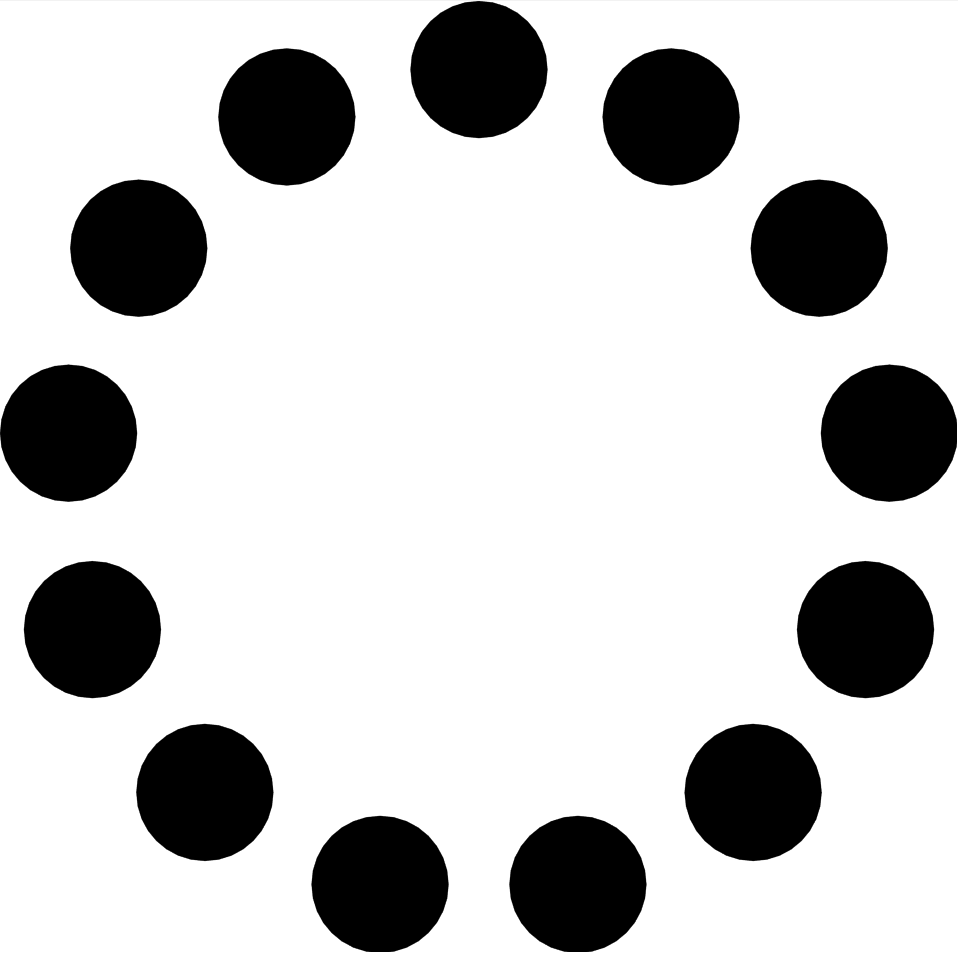
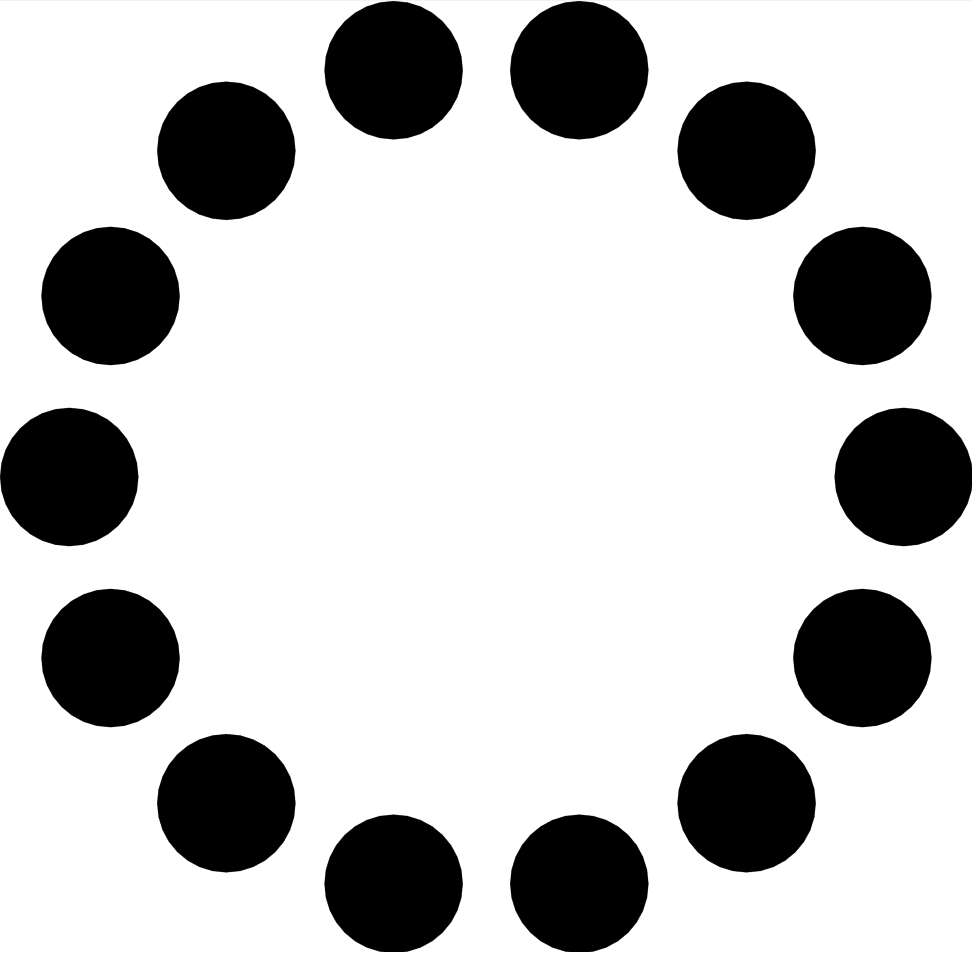
| 21:16, 21 June 2016 | Tridecagonalnumber13.png (file) |  |
38 KB | Tom | Category:tridecagonalnumbersglyph <pre>\documentclass[tikz]{standalone} \usetikzlibrary{shapes.geometric,calc} \begin{document} \begin{tikzpicture} \node (pol) [minimum size=\textwidth,regular polygon, regular polygon sides=13,color=white] at (0... | 1 |
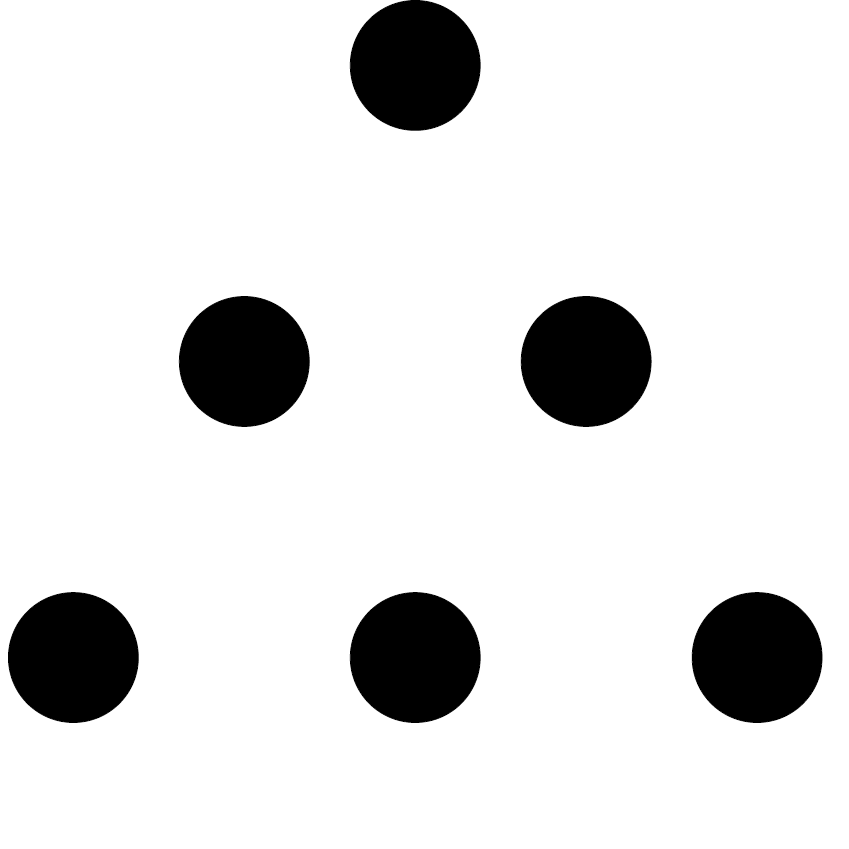
| 19:37, 21 June 2016 | Triangularnumber5glyph.png (file) |  |
18 KB | Tom | Category:Triangularnumbersglyph <pre>\documentclass[tikz]{standalone} \usetikzlibrary{shapes.geometric,calc} \begin{document} \begin{tikzpicture} \node (pol) [minimum size=\textwidth,regular polygon, regular polygon sides=3,color=white] at (0,0)... | 1 |
| 19:42, 21 June 2016 | Triangularnumber3glyph.png (file) |  |
16 KB | Tom | Category:Triangularnumbersglyph <pre>\documentclass[tikz]{standalone} \usetikzlibrary{shapes.geometric,calc} \begin{document} \begin{tikzpicture} \node (pol) [minimum size=\textwidth,regular polygon, regular polygon sides=3,color=white] at (0,0)... | 1 |
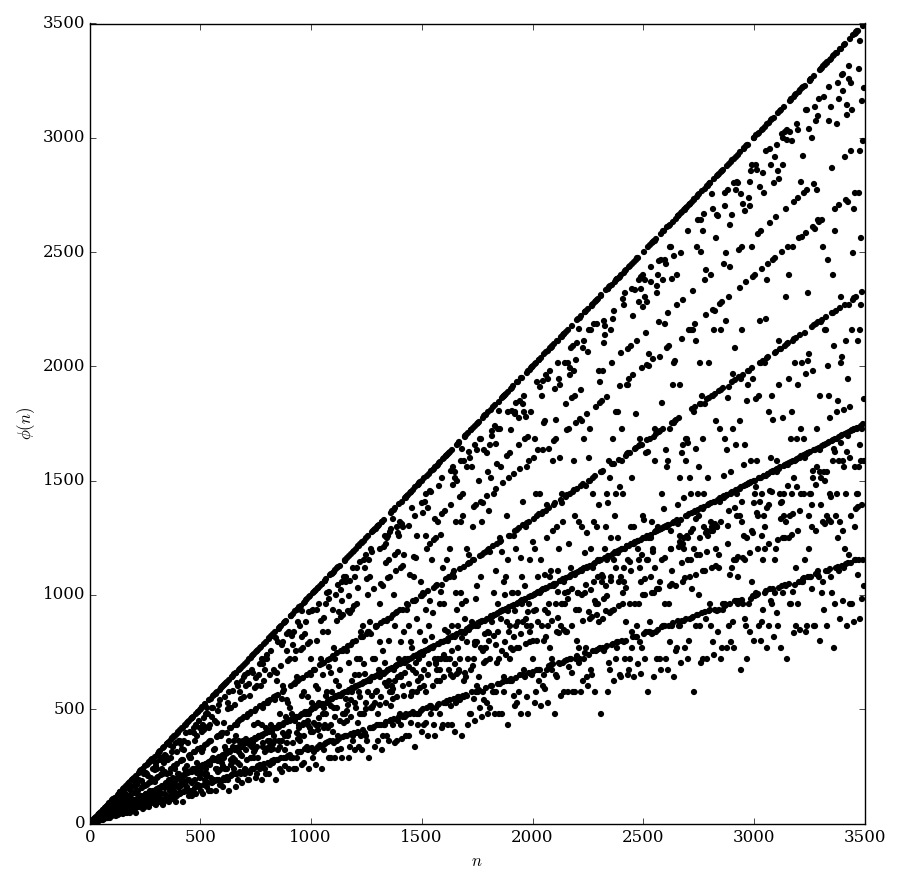
| 04:15, 22 June 2016 | Totientplot,to3500.png (file) |  |
80 KB | Tom | Category:Plot <pre>#!/usr/bin/python import numpy as np import matplotlib.pyplot as plt import fractions from mpmath import * from pylab import rcParams rcParams['figure.figsize'] = 10, 10 def totient(n): amount = 0 for k in range... | 1 |
| 05:00, 22 June 2016 | Totientglyph.png (file) |  |
5 KB | Tom | Category:totientglyph <pre>#!/usr/bin/python import numpy as np import matplotlib.pyplot as plt import fractions from mpmath import * from pylab import rcParams rcParams['figure.figsize'] = 2.4,2.4 def totient(n): amount = 0 for k... | 1 |
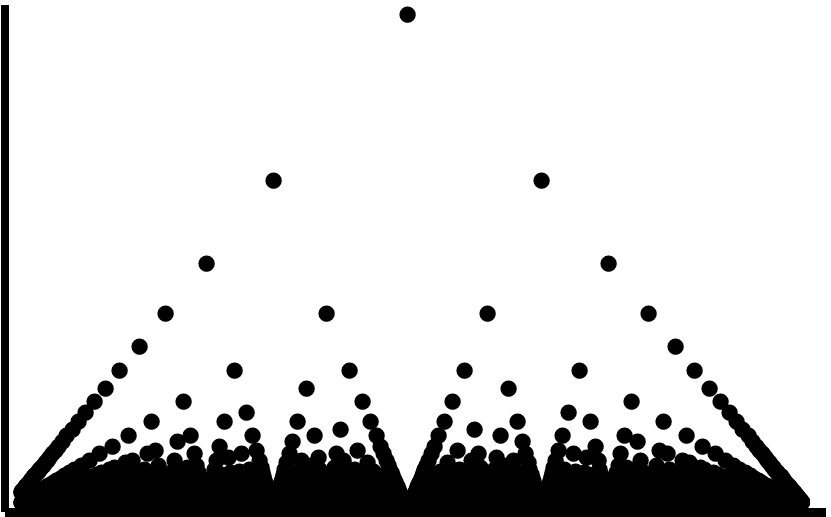
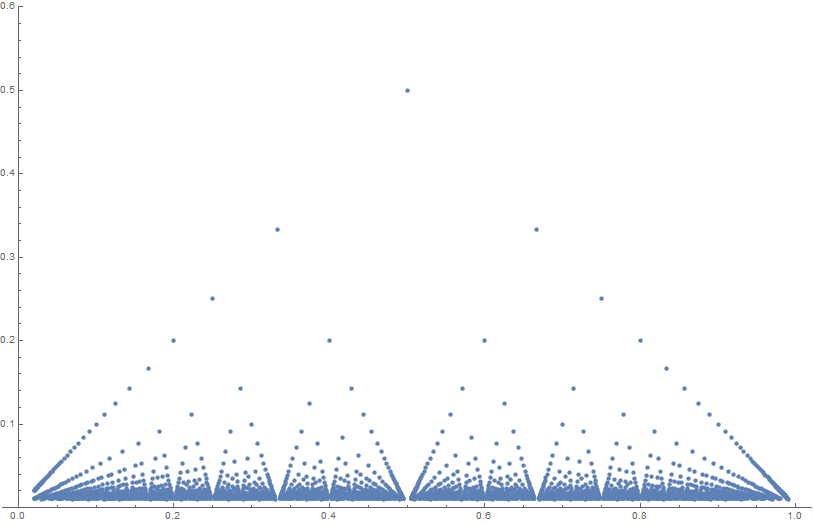
| 07:44, 19 January 2015 | Thomaethumb.png (file) |  |
14 KB | Tom | Using [http://mathematica.stackexchange.com/questions/5489/how-do-i-plot-thomaes-function-in-mathematica this implementation] with ListPlot[pq, PlotRange -> {0, 0.51}, PlotStyle -> {PointSize[0.02], Black}, FillingStyle -> None, AxesStyle -> Thic... | 1 |
| 23:10, 1 April 2015 | Thomae.png (file) |  |
25 KB | Tom | see this for details on how it was plotted | 1 |
| 21:20, 21 June 2016 | Tetradecagonalnumber14.png (file) |  |
41 KB | Tom | Category:tetradecagonalnumbersglyph <pre>\documentclass[tikz]{standalone} \usetikzlibrary{shapes.geometric,calc} \begin{document} \begin{tikzpicture} \node (pol) [minimum size=\textwidth,regular polygon, regular polygon sides=14,color=white] at... | 1 |
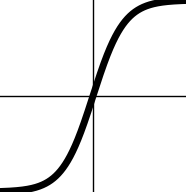
| 04:26, 19 January 2015 | Tanhthumb.png (file) |  |
10 KB | Tom | Plot[Tanh[x], {x, -3, 3}, PlotStyle -> {Thickness[0.04], Black}, AxesStyle -> Thickness[0.01], Ticks -> None] | 1 |
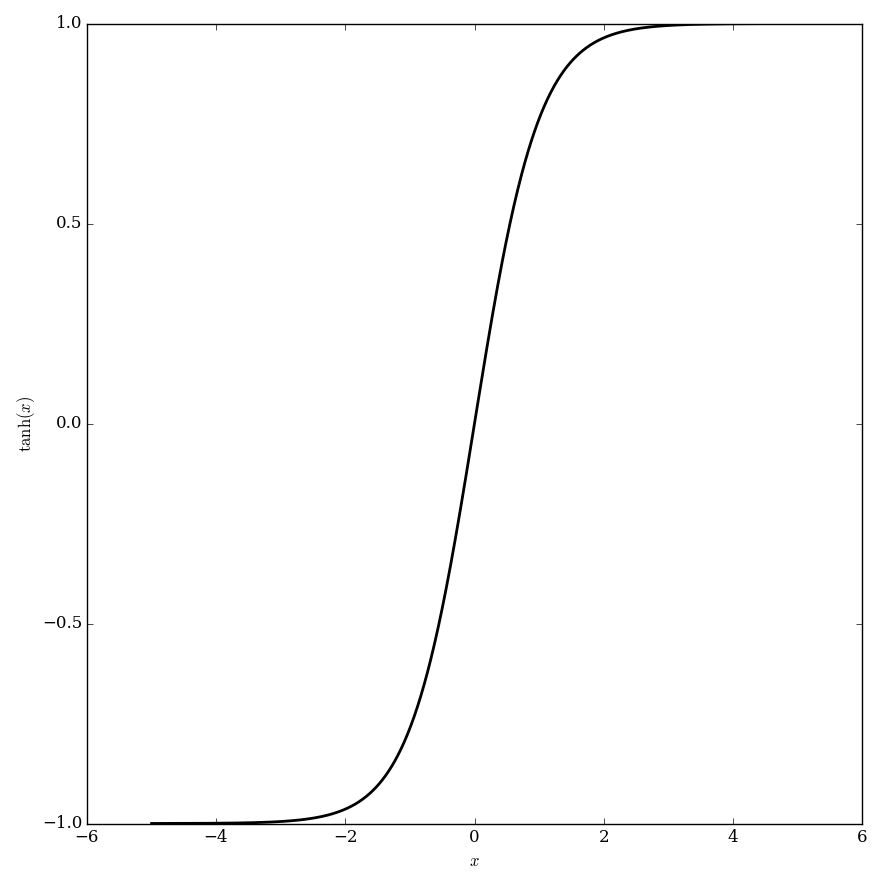
| 06:52, 9 June 2016 | Tanhplot.png (file) |  |
25 KB | Tom | Category:Plot <pre>#!/usr/bin/python import numpy as np import matplotlib.pyplot as plt from mpmath import * from pylab import rcParams rcParams['figure.figsize'] = 10, 10 x=np.arange(-5,5,0.01); f=np.vectorize(tanh) y=f(x) fig, ax = plt.subplots... | 2 |
| 20:36, 14 May 2016 | Tanhglyph.png (file) |  |
4 KB | Tom | Category:Tanhglyph <pre>#!/usr/bin/python import numpy as np import matplotlib.pyplot as plt from mpmath import * from pylab import rcParams rcParams['figure.figsize'] = 2.4,2.4 x=np.arange(-3,3,0.00001) f=np.vectorize(tanh) y=f(x) fig, ax = plt.... | 1 |
| 23:00, 19 May 2015 | Tanhcthumb.png (file) |  |
11 KB | Tom | Plot[Tanh[x]/x, {x, -8, 8}, PlotStyle -> {Thickness[0.04], Black}, AxesStyle -> Thickness[0.01], Ticks -> None] | 1 |
| 01:37, 5 January 2017 | Tanhcglyph.png (file) |  |
5 KB | Tom | Category:tanhcglyph <pre>#!/usr/bin/python import numpy as np import matplotlib.pyplot as plt from mpmath import * from pylab import rcParams rcParams['figure.figsize'] = 2.4,2.4 x1=np.arange(-20,20,0.001) f=np.vectorize(lambda x: tanh(x)/x) y1=f(... | 1 |
| 03:47, 19 January 2015 | Tangentthumb.png (file) |  |
10 KB | Tom | Plot[Tan[x], {x, 0, 2*Pi}, PlotStyle -> {Thickness[0.04], Black}, PlotRange -> {-1.1, 1.1}, AxesStyle -> Thickness[0.01], Ticks -> None] | 1 |
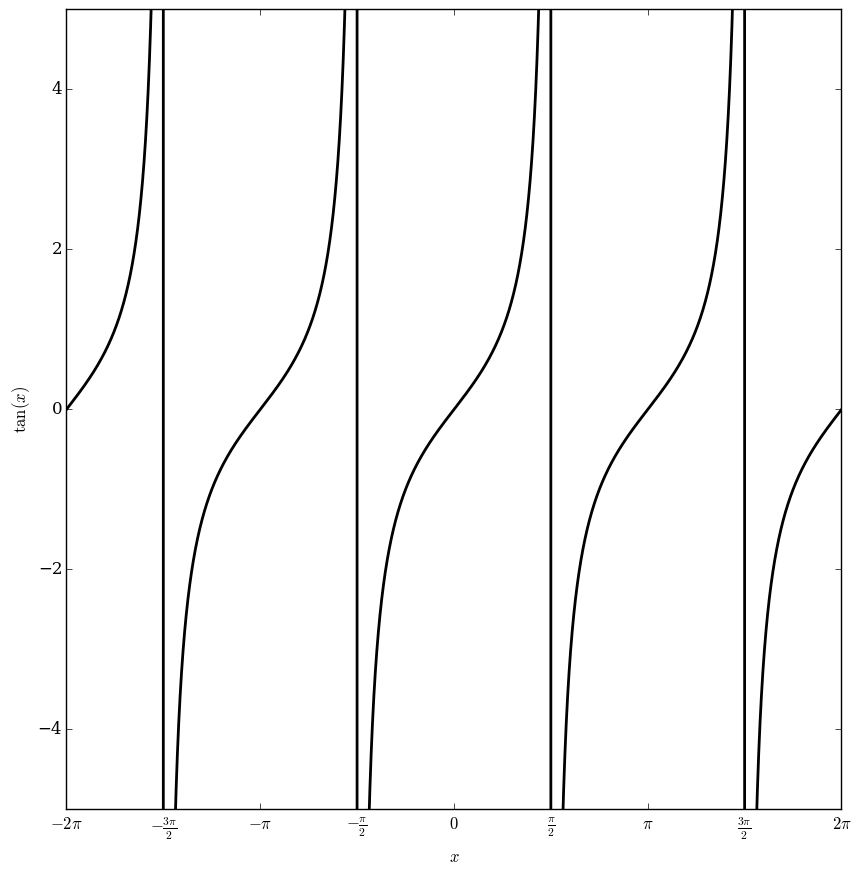
| 03:16, 8 February 2016 | Tangentplot.png (file) |  |
37 KB | Tom | Category:Plot <pre>#!/usr/bin/python import numpy as np import matplotlib.pyplot as plt from mpmath import * from pylab import rcParams rcParams['figure.figsize'] = 10, 10 x=np.arange(-2*pi+0.0001,2*pi-0.001,0.00001); f=np.vectorize(tan) y=f(x) f... | 1 |
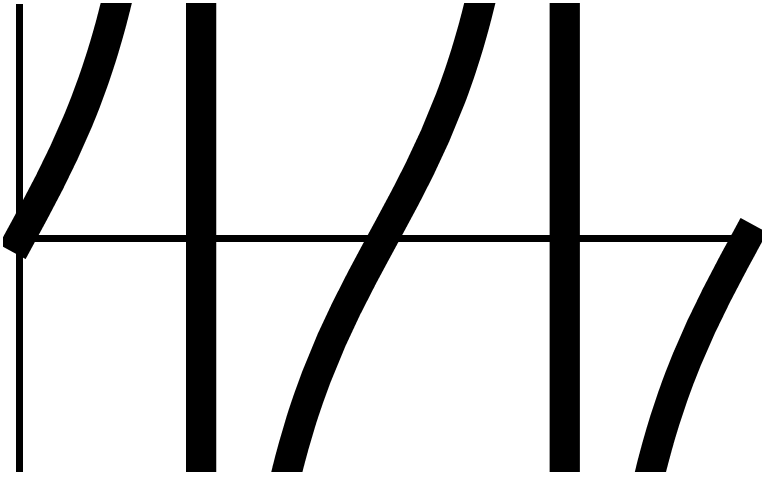
| 17:59, 29 January 2016 | Tangentglyph.png (file) |  |
4 KB | Tom | <pre> #!/usr/bin/python import numpy as np import matplotlib.pyplot as plt from mpmath import * from pylab import rcParams rcParams['figure.figsize'] = 2.4,2.4 x=np.arange(0,2*pi,0.00001) f=np.vectorize(tan) y=f(x) fig, ax = plt.subplots() plt.ylim([... | 1 |
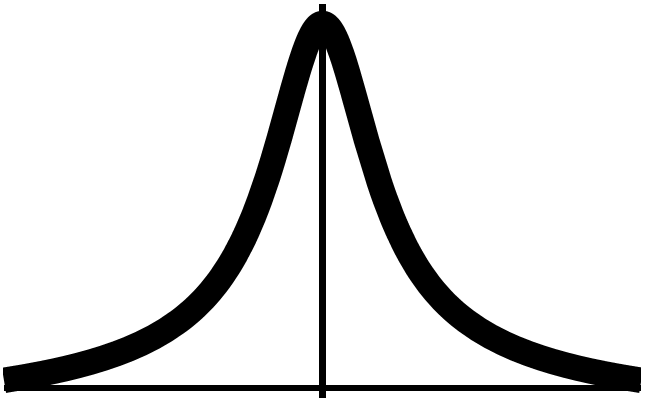
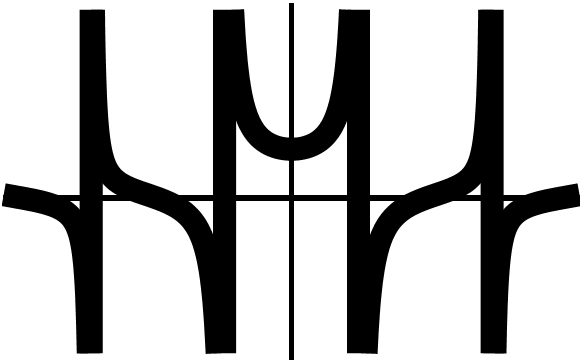
| 05:44, 18 May 2015 | Tancthumb.png (file) |  |
9 KB | Tom | g[z_] := Tan[z]/z Plot[g[x], {x, -6.5, 6.5}, PlotStyle -> {Thickness[0.04], Black}, AxesStyle -> Thickness[0.01], Ticks -> None] | 1 |
| 01:34, 5 January 2017 | Tancglyph.png (file) |  |
5 KB | Tom | Category:tancglyph <pre>#!/usr/bin/python import numpy as np import matplotlib.pyplot as plt from mpmath import * from pylab import rcParams rcParams['figure.figsize'] = 2.4,2.4 x1=np.arange(-20,20,0.001) f=np.vectorize(lambda x: tan(x)/x) y1=f(x1... | 1 |
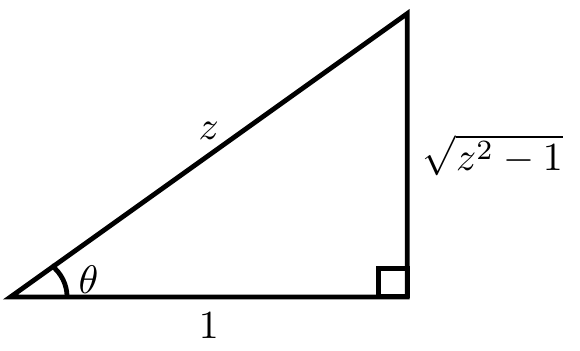
| 23:40, 8 December 2016 | Tan(arcsec(z)).png (file) | ).png) |
7 KB | Tom | <pre>\documentclass[10pt,a4paper]{article} \usepackage[latin1]{inputenc} \usepackage{amsmath} \usepackage{tikz} \usepackage{amsfonts} \usepackage{amssymb} \begin{document} \begin{tikzpicture}[very thick] \draw (0,0) -- (0:3.5cm) node[midway,below] {$... | 1 |
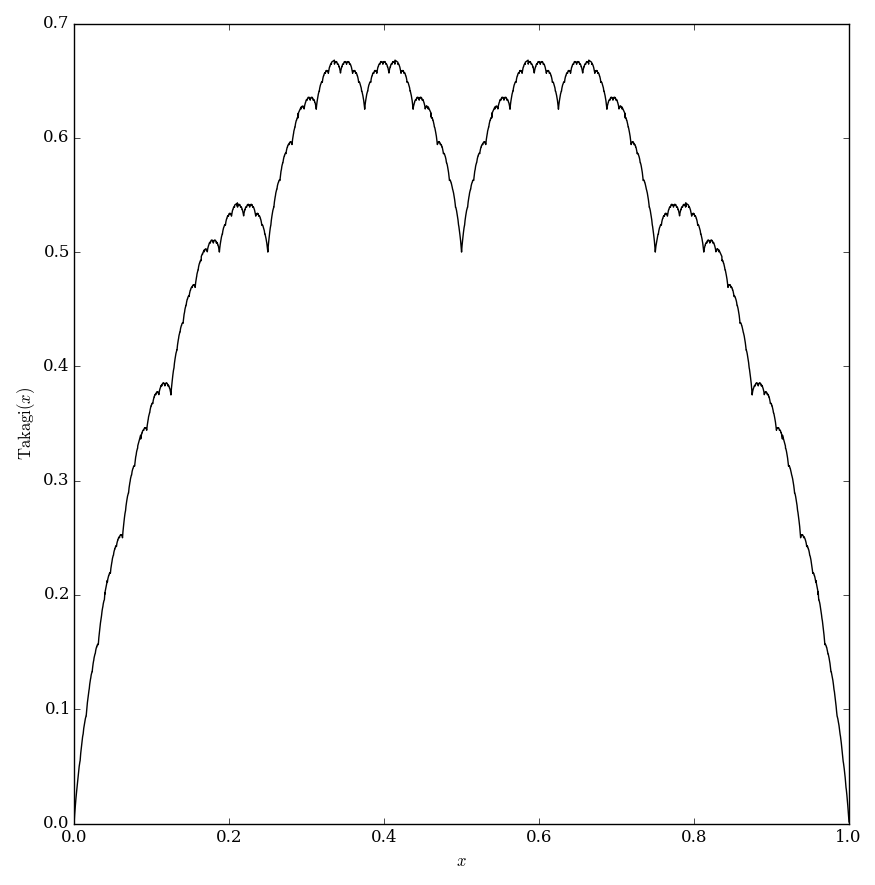
| 03:14, 6 July 2016 | Takagiplot.png (file) |  |
46 KB | Tom | Category:Plot <pre>#!/usr/bin/python import numpy as np import matplotlib.pyplot as plt from mpmath import * from pylab import rcParams rcParams['figure.figsize'] = 10, 10 def distfnc(x): return min(x-floor(x),ceil(x)-x) def takagi(x):... | 2 |
| 03:07, 6 July 2016 | Takagiglyph.png (file) |  |
6 KB | Tom | Category:takagiglyph <pre>#!/usr/bin/python import numpy as np import matplotlib.pyplot as plt from mpmath import * from pylab import rcParams rcParams['figure.figsize'] = 2.4,2.4 def distfnc(x): return min(x-floor(x),ceil(x)-x) def takag... | 1 |
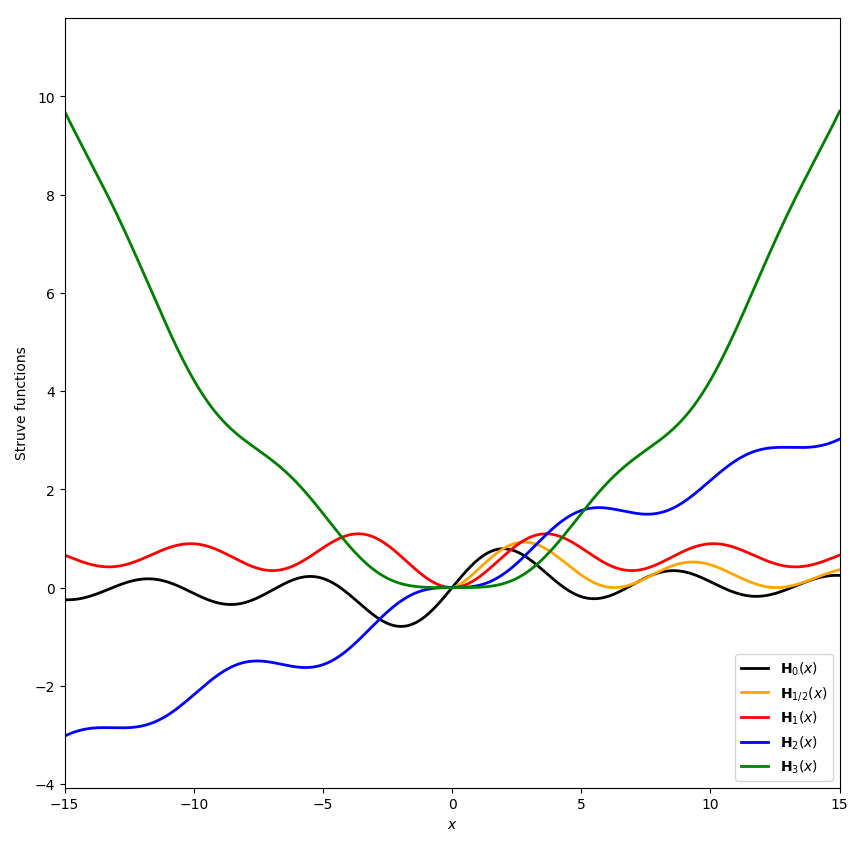
| 00:14, 22 October 2017 | Struveplots.png (file) |  |
64 KB | Tom | <pre>#!/usr/bin/python import numpy as np import matplotlib.pyplot as plt from mpmath import * from pylab import rcParams import scipy.special rcParams['figure.figsize'] = 10, 10 x=np.arange(-16,16,0.001); f=np.vectorize(lambda x: scipy.special.struve... | 1 |
| 21:59, 28 October 2017 | Struveh2glyph.png (file) |  |
5 KB | Tom | 1 | |
| 00:06, 24 October 2017 | Struveh1glyph.png (file) |  |
8 KB | Tom | Category:Scorerhiglyph <pre>#!/usr/bin/python import numpy as np import matplotlib.pyplot as plt from mpmath import * from pylab import rcParams import scipy.special rcParams['figure.figsize'] = 2.4,2.4 x1=np.arange(-10,10,0.001) f=np.vectorize(la... | 1 |
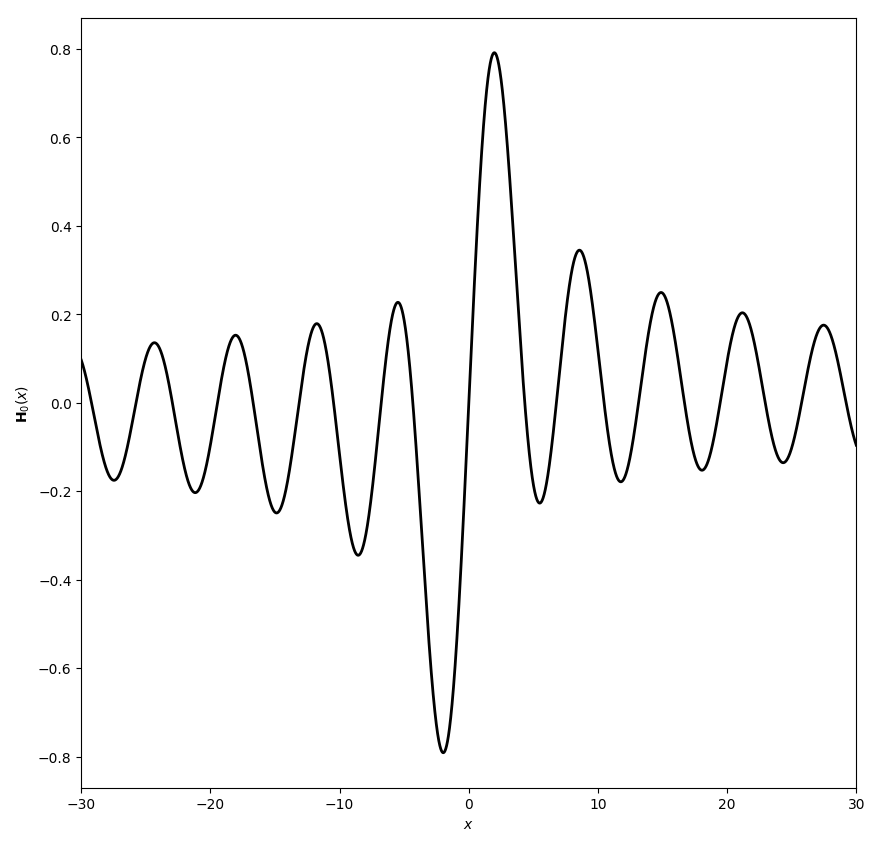
| 00:05, 22 October 2017 | Struveh0plot.png (file) |  |
49 KB | Tom | #!/usr/bin/python import numpy as np import matplotlib.pyplot as plt from mpmath import * from pylab import rcParams import scipy.special rcParams['figure.figsize'] = 10, 10 x=np.arange(-30,30,0.001); f=np.vectorize(lambda x: scipy.special.struve(0,x)... | 1 |
| 21:59, 28 October 2017 | Struveh0glyph.png (file) |  |
8 KB | Tom | 2 | |
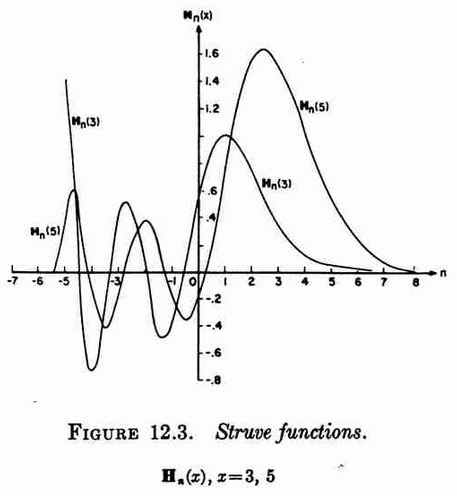
| 18:33, 28 June 2015 | Struvefunctions(abramowitzandstegun).png (file) | .png) |
84 KB | Tom | http://dualaud.net/specialfunctionswiki/abramowitz_and_stegun-1.03/page_497.htm | 1 |
| 19:50, 21 June 2016 | Squarenumber4glyph.png (file) |  |
20 KB | Tom | Category:Squarenumbersglyph <pre>\documentclass[tikz]{standalone} \usetikzlibrary{shapes.geometric,calc} \begin{document} \begin{tikzpicture} \node (pol) [minimum size=\textwidth,regular polygon, regular polygon sides=4,color=white] at (0,0) {};... | 1 |
| 20:03, 19 May 2015 | Sphericalbesselythumb.png (file) |  |
6 KB | Tom | Plot[SphericalBesselY[0, x], {x, -12, 12}, PlotStyle -> {Thickness[0.04], Black}, AxesStyle -> Thickness[0.01], Ticks -> None] | 1 |
| 23:13, 10 June 2016 | Sphericalbessely,n=0glyph.png (file) |  |
7 KB | Tom | Category:Sphericalbessely <pre>#!/usr/bin/python import numpy as np import matplotlib.pyplot as plt from mpmath import * from pylab import rcParams rcParams['figure.figsize'] = 2.4,2.4 def sphericalbessely(n,z): return ((pi/(2*z))**(1/2))*... | 1 |
| 20:03, 19 May 2015 | Sphericalbesseljthumb.png (file) |  |
6 KB | Tom | Plot[SphericalBesselJ[0, x], {x, -12, 12}, PlotStyle -> {Thickness[0.04], Black}, AxesStyle -> Thickness[0.01], Ticks -> None] | 1 |
| 22:59, 10 June 2016 | Sphericalbesselj,n=0glyph.png (file) |  |
7 KB | Tom | Category:Sphericalbesseljglyph <pre>#!/usr/bin/python import numpy as np import matplotlib.pyplot as plt from mpmath import * from pylab import rcParams rcParams['figure.figsize'] = 2.4,2.4 def sphericalbesselj(n,z): return ((pi/(2*z))**(1... | 1 |
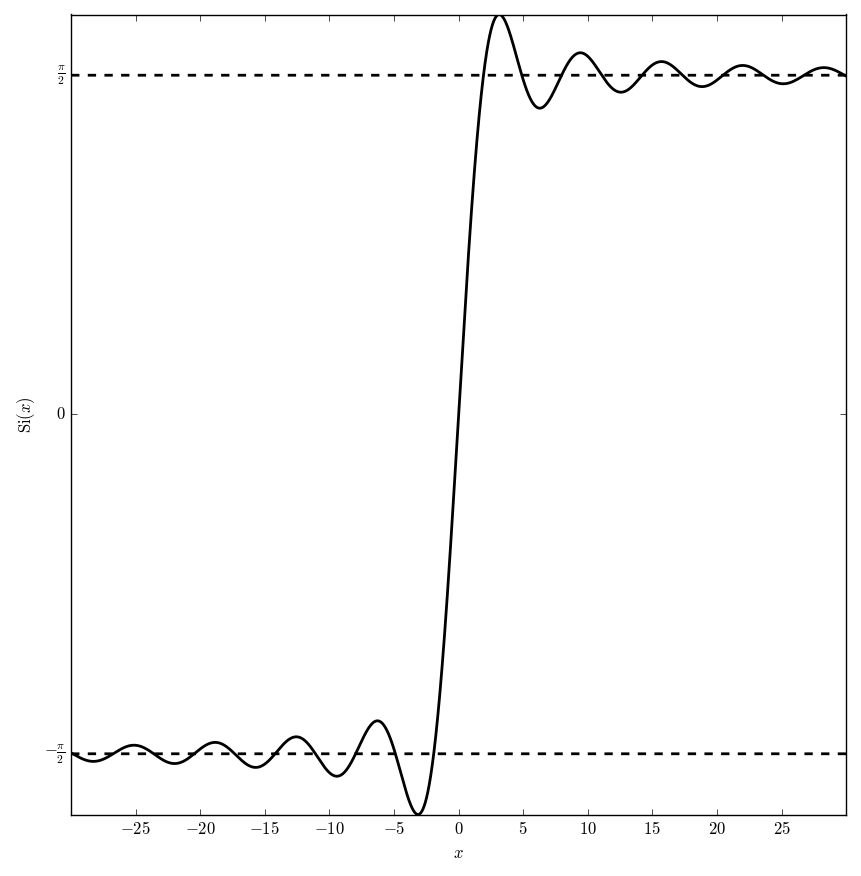
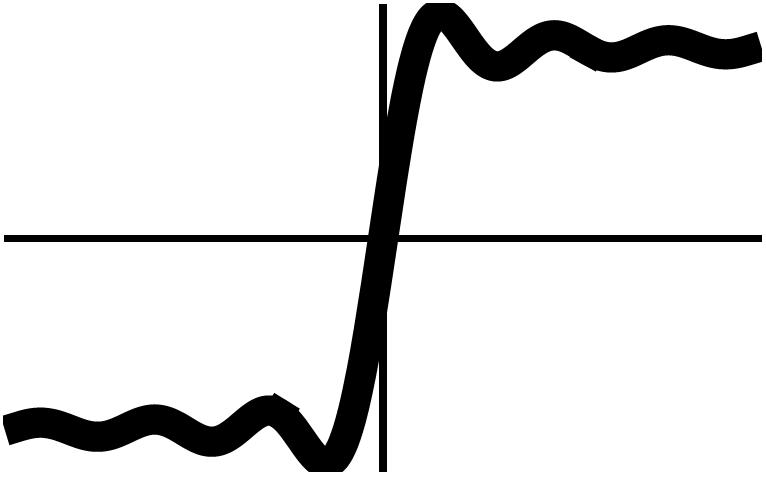
| 21:46, 23 May 2016 | Siplot.png (file) |  |
30 KB | Tom | Category:Plot <pre>#!/usr/bin/python import numpy as np import matplotlib.pyplot as plt from mpmath import * from pylab import rcParams rcParams['figure.figsize'] = 10, 10 x=np.arange(-30,30,0.001); f=np.vectorize(si) y1=f(x) def g(x): re... | 1 |
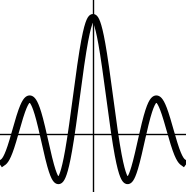
| 04:38, 19 January 2015 | Sinintegralthumb.png (file) |  |
13 KB | Tom | Plot[SinIntegral[x], {x, -20, 20}, PlotStyle -> {Thickness[0.04], Black}, AxesStyle -> Thickness[0.01], Ticks -> None] | 1 |
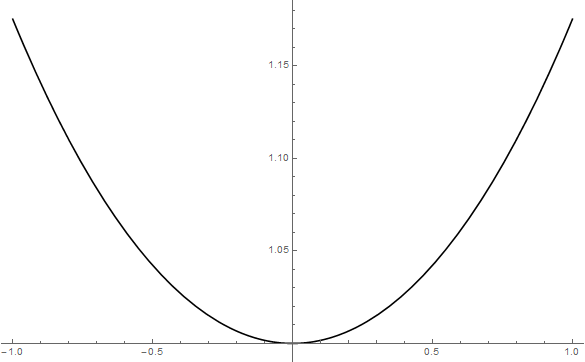
| 06:09, 18 May 2015 | Sinhz plot.png (file) |  |
10 KB | Tom | g[z_] := Sinh[z]/z Plot[g[x], {x, -1, 1}, PlotStyle -> {Black}] | 1 |
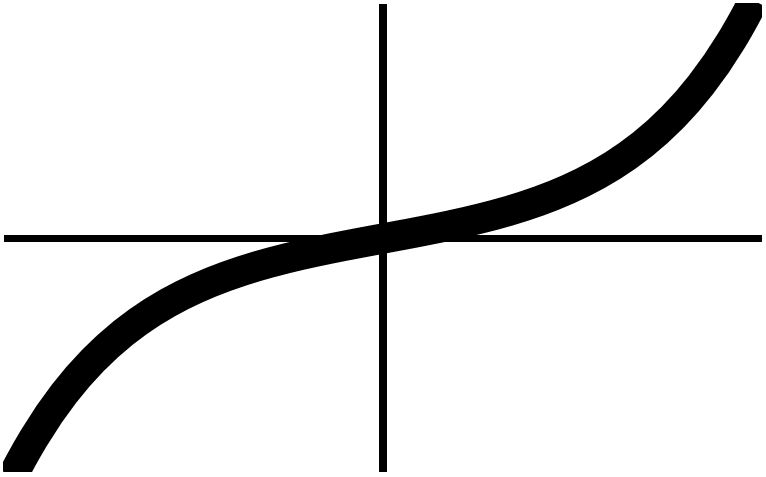
| 04:25, 19 January 2015 | Sinhthumb.png (file) |  |
11 KB | Tom | Plot[Sinh[x], {x, -3, 3}, PlotStyle -> {Thickness[0.04], Black}, AxesStyle -> Thickness[0.01], Ticks -> None] | 1 |
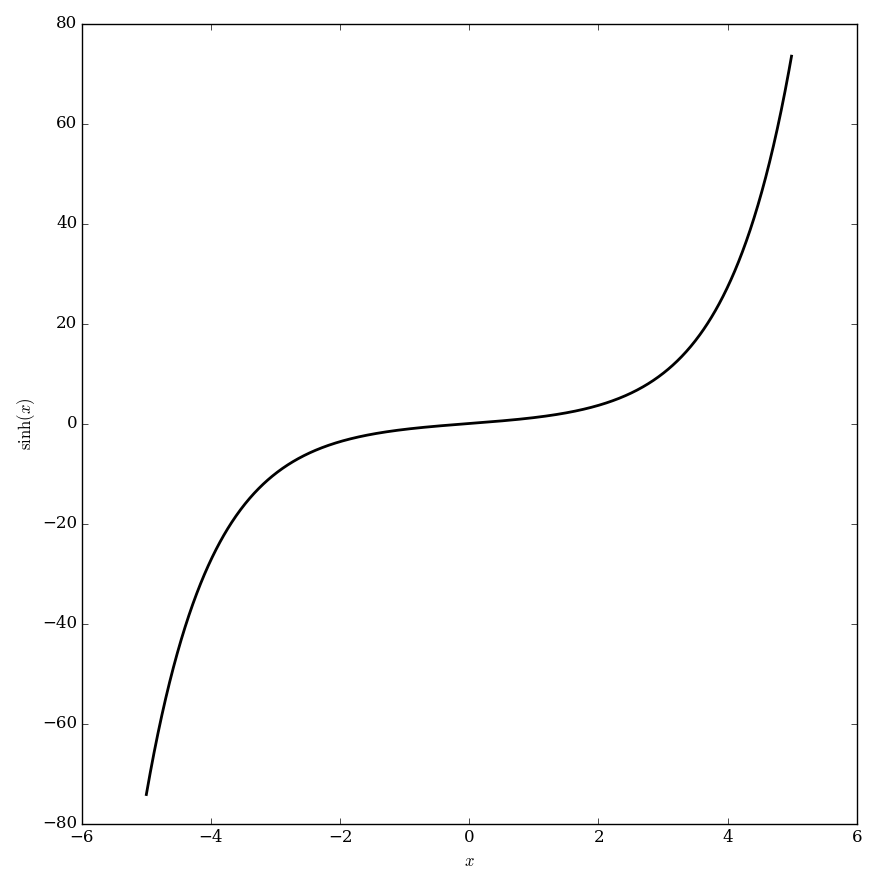
| 06:48, 9 June 2016 | Sinhplot.png (file) |  |
29 KB | Tom | Category:Plot <pre>#!/usr/bin/python import numpy as np import matplotlib.pyplot as plt from mpmath import * from pylab import rcParams rcParams['figure.figsize'] = 10, 10 x=np.arange(-5,5,0.01); f=np.vectorize(sinh) y=f(x) fig, ax = plt.subplots... | 2 |
| 04:36, 19 January 2015 | Sinhintegralthumb.png (file) |  |
10 KB | Tom | Plot[SinhIntegral[x], {x, -5, 5}, PlotStyle -> {Thickness[0.04], Black}, AxesStyle -> Thickness[0.01], Ticks -> None] | 1 |
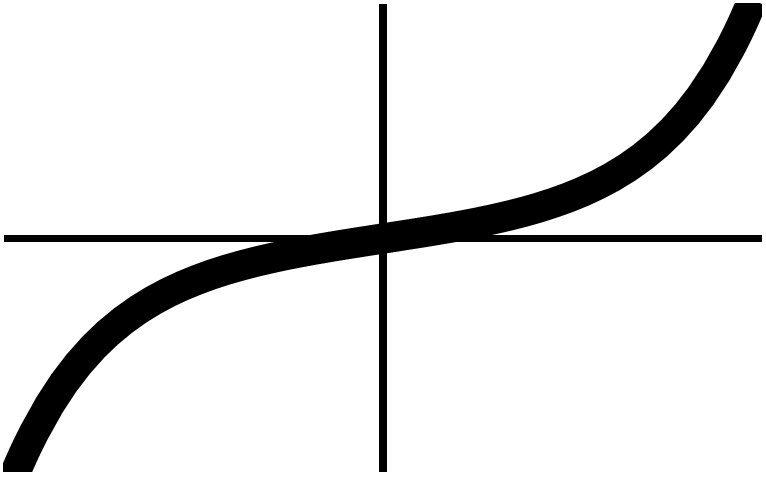
| 20:27, 14 May 2016 | Sinhglyph.png (file) |  |
4 KB | Tom | <pre> #!/usr/bin/python import numpy as np import matplotlib.pyplot as plt from mpmath import * from pylab import rcParams rcParams['figure.figsize'] = 2.4,2.4 x=np.arange(-3,3,0.00001) f=np.vectorize(sinh) y=f(x) fig, ax = plt.subplots() #plt.ylim([... | 1 |
| 01:24, 5 January 2017 | Sinhcglyph.png (file) |  |
4 KB | Tom | Category:sinhcglyph <pre>#!/usr/bin/python import numpy as np import matplotlib.pyplot as plt from mpmath import * from pylab import rcParams rcParams['figure.figsize'] = 2.4,2.4 x1=np.arange(-2,2,0.0001) f=np.vectorize(lambda x: sinh(x)/x) y1=f(x... | 1 |
| 06:10, 18 May 2015 | Sinhc thumb.png (file) |  |
10 KB | Tom | g[z_] := Sinh[z]/z Plot[g[x], {x, -0.5, 0.5}, PlotStyle -> {Thickness[0.04], Black}, AxesStyle -> Thickness[0.01], Ticks -> None] | 1 |
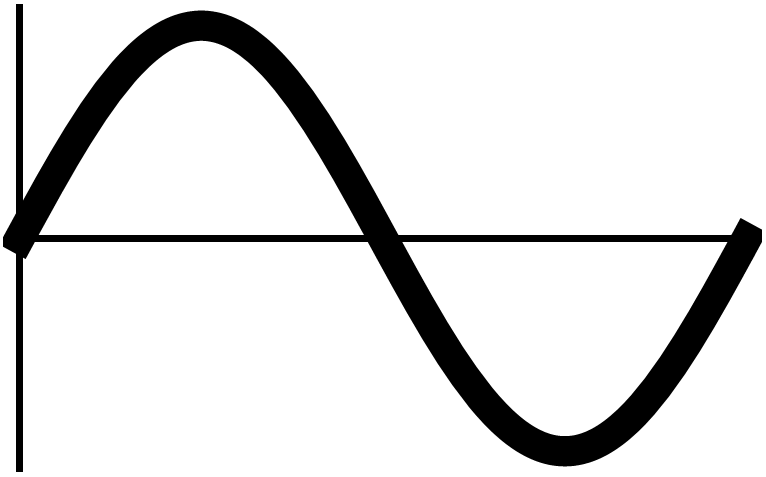
| 03:38, 19 January 2015 | Sinethumb.png (file) |  |
14 KB | Tom | Plot[Sin[x], {x, 0, 2*Pi}, PlotStyle -> {Thickness[0.04], Black}, PlotRange -> {-1.1, 1.1}, AxesStyle -> Thickness[0.01], Ticks -> None] | 1 |
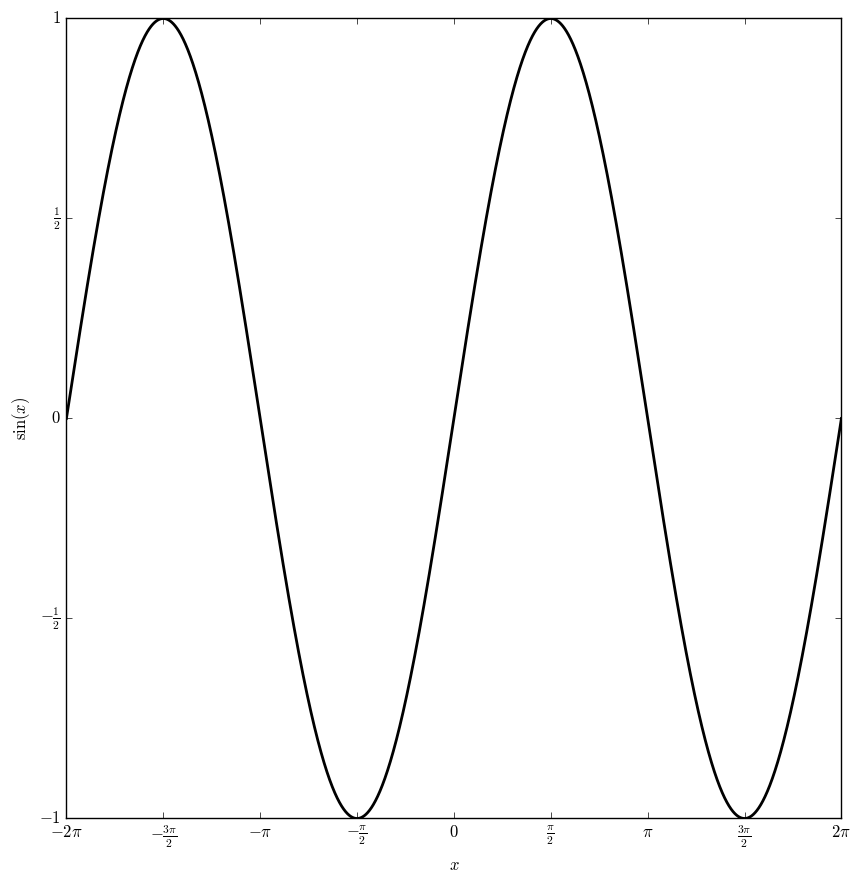
| 02:00, 8 February 2016 | Sineplot.png (file) |  |
41 KB | Tom | <pre>#!/usr/bin/python import numpy as np import matplotlib.pyplot as plt from mpmath import * from pylab import rcParams rcParams['figure.figsize'] = 10, 10 x=np.arange(-2*pi,2*pi,0.00001); f=np.vectorize(sin) y=f(x) fig, ax = plt.subplots() xlabel... | 1 |
First page |
Previous page |
Next page |
Last page |