File list
This special page shows all uploaded files.
First page |
Previous page |
Next page |
Last page |
| Date | Name | Thumbnail | Size | User | Description | Versions |
|---|---|---|---|---|---|---|
| 09:03, 19 January 2015 | Abelpolynomialthumb.png (file) |  |
7 KB | Tom | Plot[{x, -2 x + x^2, 9 x - 6 x^2 + x^3}, {x, -1, 3}, PlotStyle -> {{Thickness[0.015], Black}, {Thickness[0.015], Black}, {Thickness[0.015], Black}}, AxesStyle -> Thickness[0.01], Ticks -> None] | 1 |
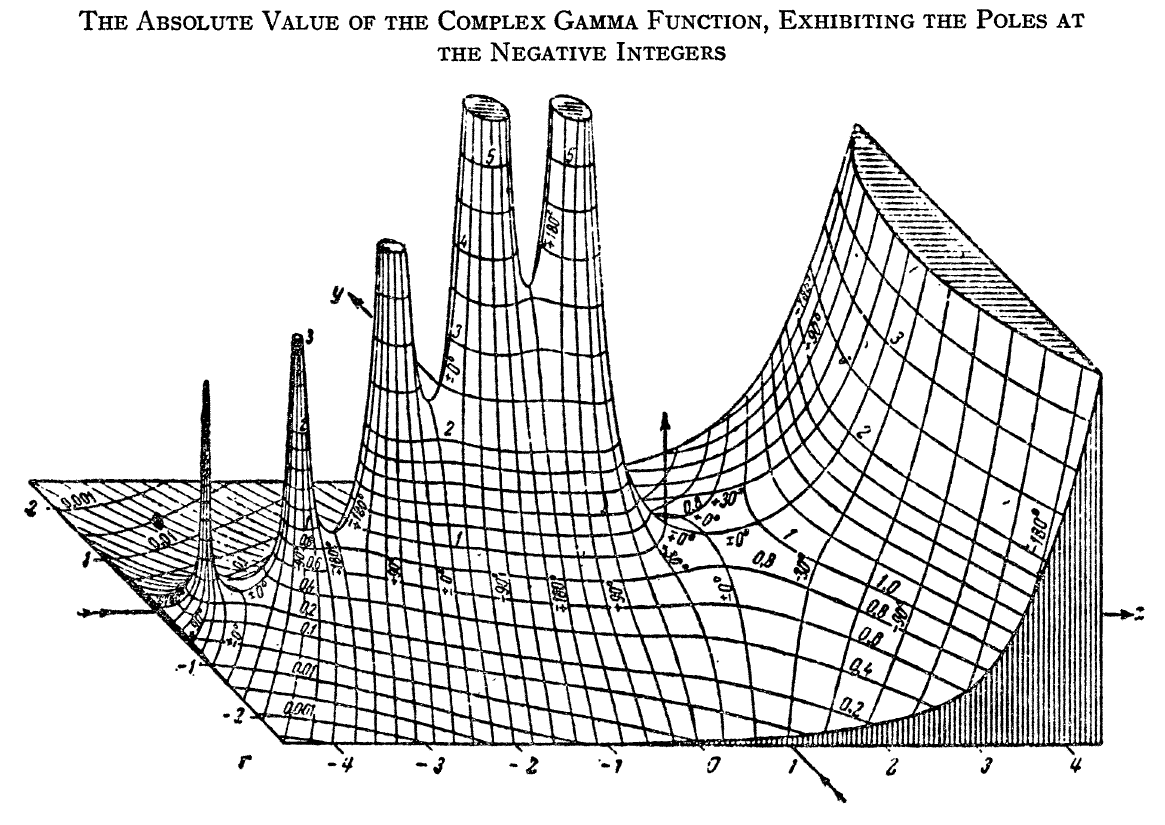
| 22:54, 13 January 2015 | Absvalgamma.png (file) |  |
185 KB | Tom | From http://www.jstor.org/discover/10.2307/2309786?sid=21105065140641&uid=3739256&uid=2129&uid=70&uid=3739744&uid=4&uid=2 | 1 |
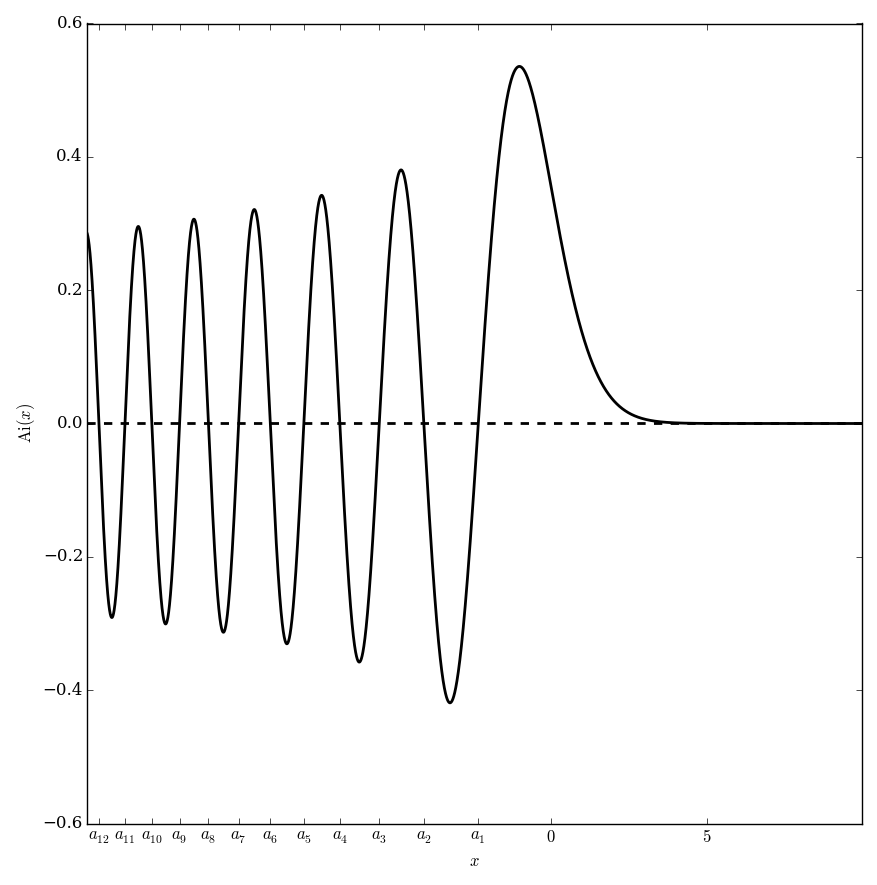
| 06:09, 16 May 2016 | Airyaiglyph.png (file) |  |
8 KB | Tom | Category:Airyaiglyph <pre>#!/usr/bin/python import numpy as np import matplotlib.pyplot as plt from mpmath import * from pylab import rcParams rcParams['figure.figsize'] = 2.4,2.4 x=np.arange(-15,3,0.001) f=np.vectorize(airyai) y=f(x) fig, ax = p... | 1 |
| 07:37, 16 May 2016 | Airyaiplot.png (file) |  |
49 KB | Tom | Category:Plot <pre>#!/usr/bin/python import numpy as np import matplotlib.pyplot as plt from mpmath import * cplot(airyai,[-10,10],[-10,10],points=50000,verbose=True) plt.title('Domain coloring of $\mathrm{Ai}(z)$.') plt.savefig('complexairyaiplot... | 1 |
| 06:32, 19 January 2015 | Airyaithumb.png (file) |  |
21 KB | Tom | Plot[AiryAi[x], {x, -12, 3}, PlotStyle -> {Thickness[0.04], Black}, AxesStyle -> Thickness[0.01], Ticks -> None] | 1 |
| 06:30, 16 May 2016 | Airybiglyph.png (file) |  |
7 KB | Tom | Category:Airybiglyph <pre>#!/usr/bin/python import numpy as np import matplotlib.pyplot as plt from mpmath import * from pylab import rcParams rcParams['figure.figsize'] = 2.4,2.4 x=np.arange(-10,0.7,0.001) f=np.vectorize(airybi) y=f(x) fig, ax =... | 1 |
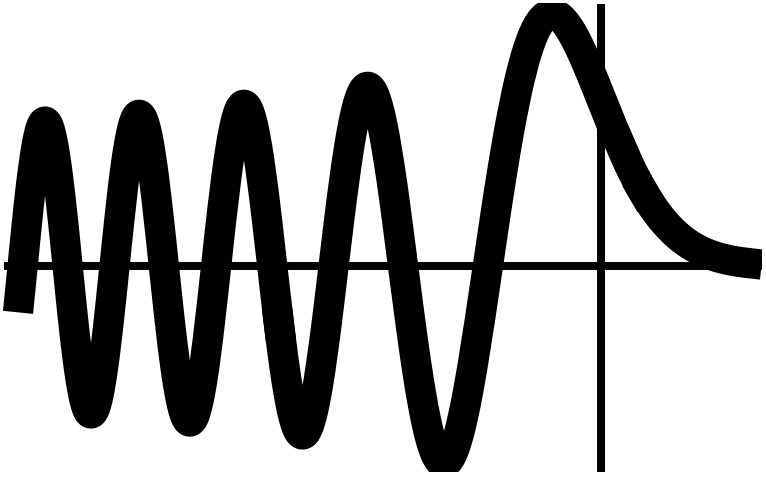
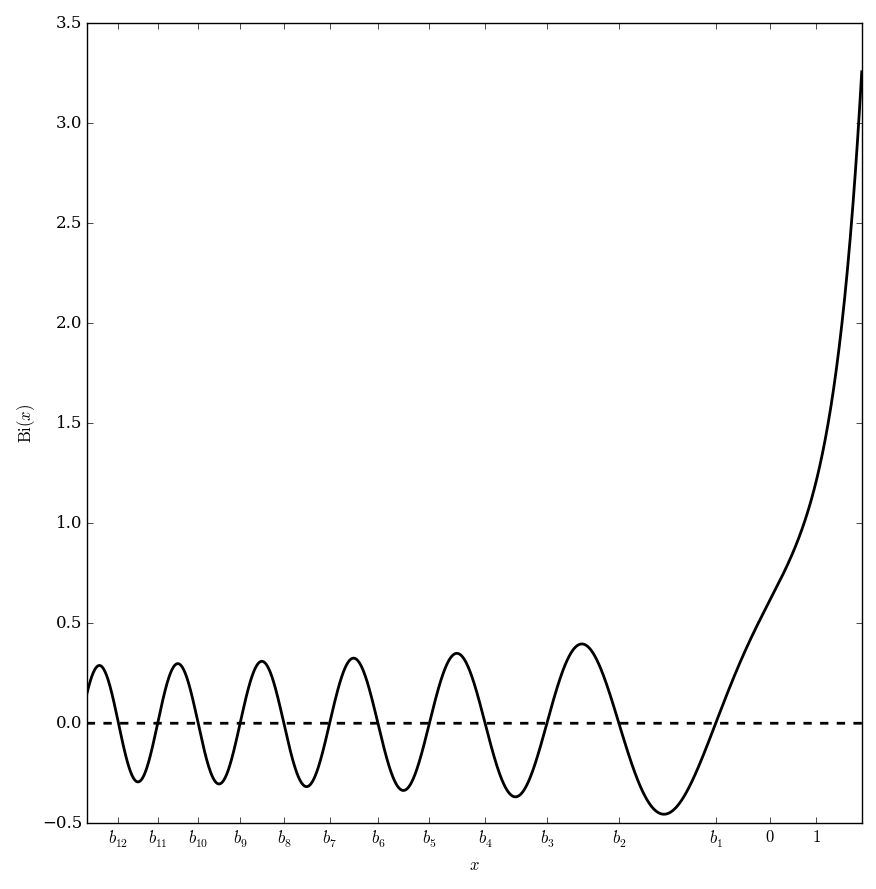
| 07:44, 16 May 2016 | Airybiplot.png (file) |  |
42 KB | Tom | Category:Plot <pre>#!/usr/bin/python import numpy as np import matplotlib.pyplot as plt from mpmath import * from pylab import rcParams rcParams['figure.figsize'] = 10, 10 x1=np.arange(-14.8,2,0.01); x2=x1 f=np.vectorize(airybi) def g(x):... | 1 |
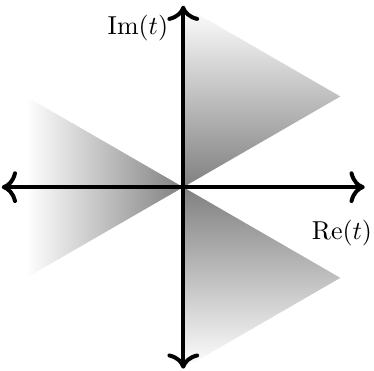
| 22:09, 13 May 2016 | Airysectors.png (file) |  |
11 KB | Tom | <pre>\documentclass{article} \usepackage{tikz} \usepackage{graphicx} \usetikzlibrary{fadings} \begin{document} \begin{tikzpicture}[scale=0.4] \fill[gray,path fading=north] (0,0) -- (4*0.866025,2) -- (0,4) -- cycle; \fill[gray,path fading=west] (0,0) -... | 1 |
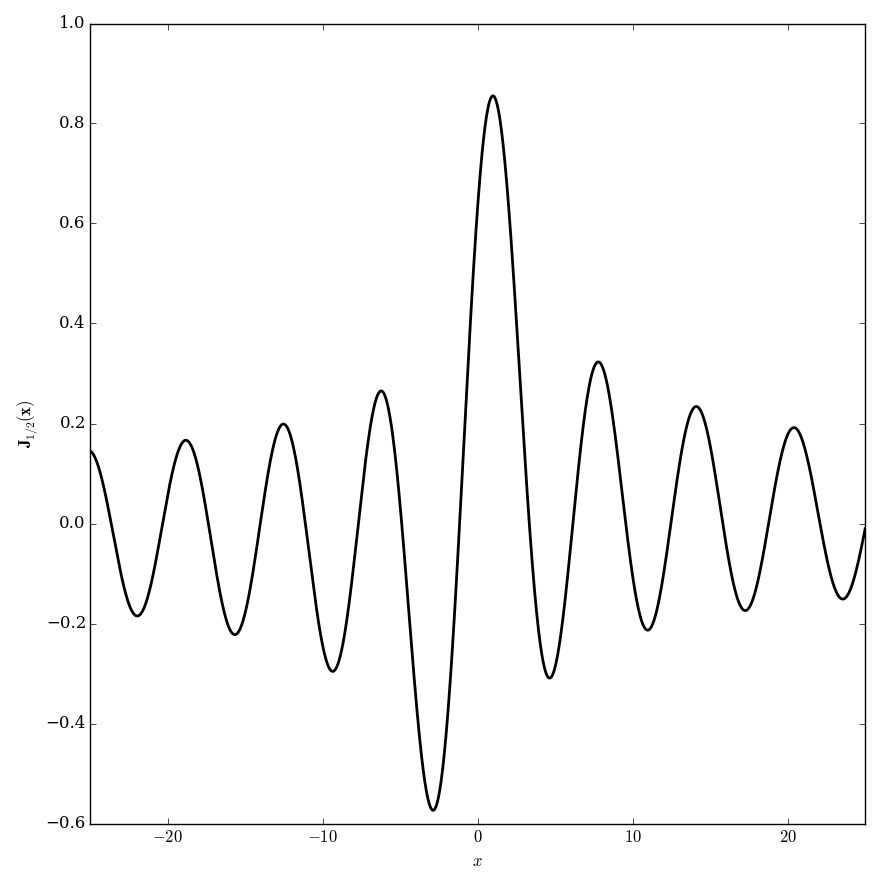
| 16:54, 23 May 2016 | Anger0.5glyph.png (file) |  |
7 KB | Tom | Category:Angerglyph <pre>#!/usr/bin/python import numpy as np import matplotlib.pyplot as plt from mpmath import * from pylab import rcParams rcParams['figure.figsize'] = 2.4,2.4 def angerintegrand(t,n,x): return cos(n*t-x*sin(t)) def ange... | 1 |
| 16:28, 23 May 2016 | Anger0.5plot.png (file) |  |
50 KB | Tom | Category:Plot <pre>#!/usr/bin/python import numpy as np import matplotlib.pyplot as plt from mpmath import * from pylab import rcParams rcParams['figure.figsize'] = 10, 10 x=np.arange(-25,25,0.01); def angerintegrand(t,n,x): return cos(n*t... | 1 |
| 16:51, 23 May 2016 | Anger0glyph.png (file) |  |
7 KB | Tom | Category:Angerglyph <pre>#!/usr/bin/python import numpy as np import matplotlib.pyplot as plt from mpmath import * from pylab import rcParams rcParams['figure.figsize'] = 2.4,2.4 def angerintegrand(t,n,x): return cos(n*t-x*sin(t)) def ange... | 1 |
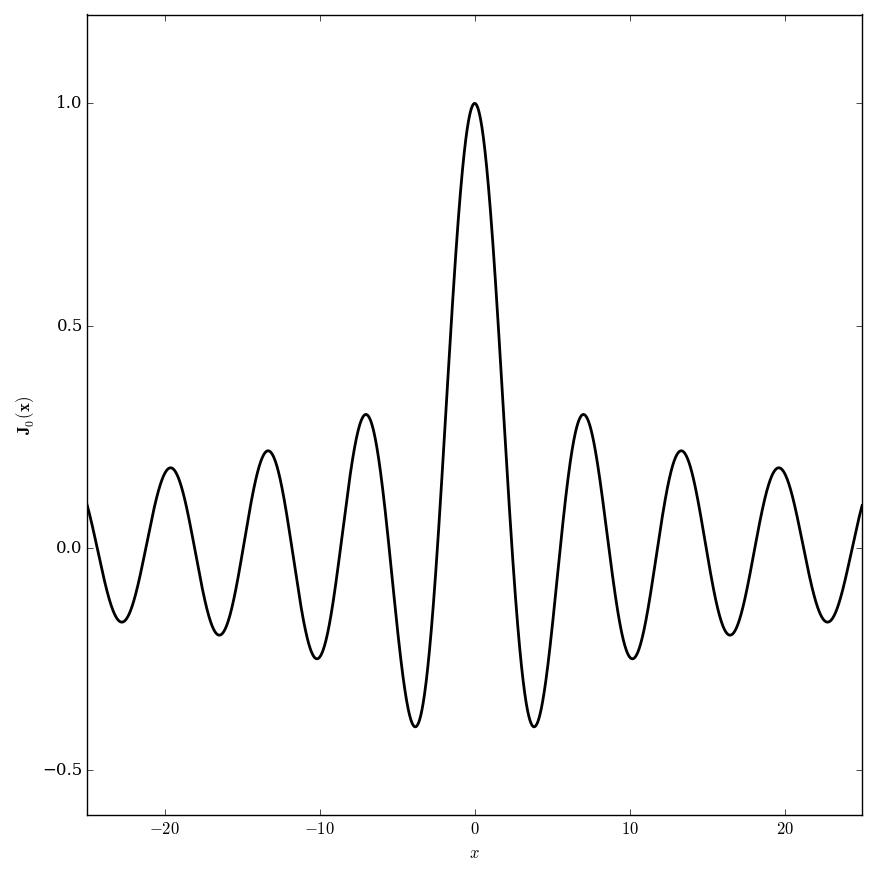
| 16:27, 23 May 2016 | Anger0plot.png (file) |  |
45 KB | Tom | Category:Plot <pre>#!/usr/bin/python import numpy as np import matplotlib.pyplot as plt from mpmath import * from pylab import rcParams rcParams['figure.figsize'] = 10, 10 x=np.arange(-25,25,0.01); def angerintegrand(t,n,x): return cos(n*t... | 1 |
| 17:03, 23 May 2016 | Anger1.5glyph.png (file) |  |
7 KB | Tom | Category:Angerglyph <pre>#!/usr/bin/python import numpy as np import matplotlib.pyplot as plt from mpmath import * from pylab import rcParams rcParams['figure.figsize'] = 2.4,2.4 def angerintegrand(t,n,x): return cos(n*t-x*sin(t)) def ange... | 1 |
| 20:16, 23 May 2016 | Anger1.5plot.png (file) |  |
58 KB | Tom | Category:Plot <pre>#!/usr/bin/python import numpy as np import matplotlib.pyplot as plt from mpmath import * from pylab import rcParams rcParams['figure.figsize'] = 10, 10 x=np.arange(-25,25,0.01); def angerintegrand(t,n,x): return cos(n*t... | 1 |
| 16:57, 23 May 2016 | Anger1glyph.png (file) |  |
7 KB | Tom | Category:Angerglyph <pre>#!/usr/bin/python import numpy as np import matplotlib.pyplot as plt from mpmath import * from pylab import rcParams rcParams['figure.figsize'] = 2.4,2.4 def angerintegrand(t,n,x): return cos(n*t-x*sin(t)) def ange... | 1 |
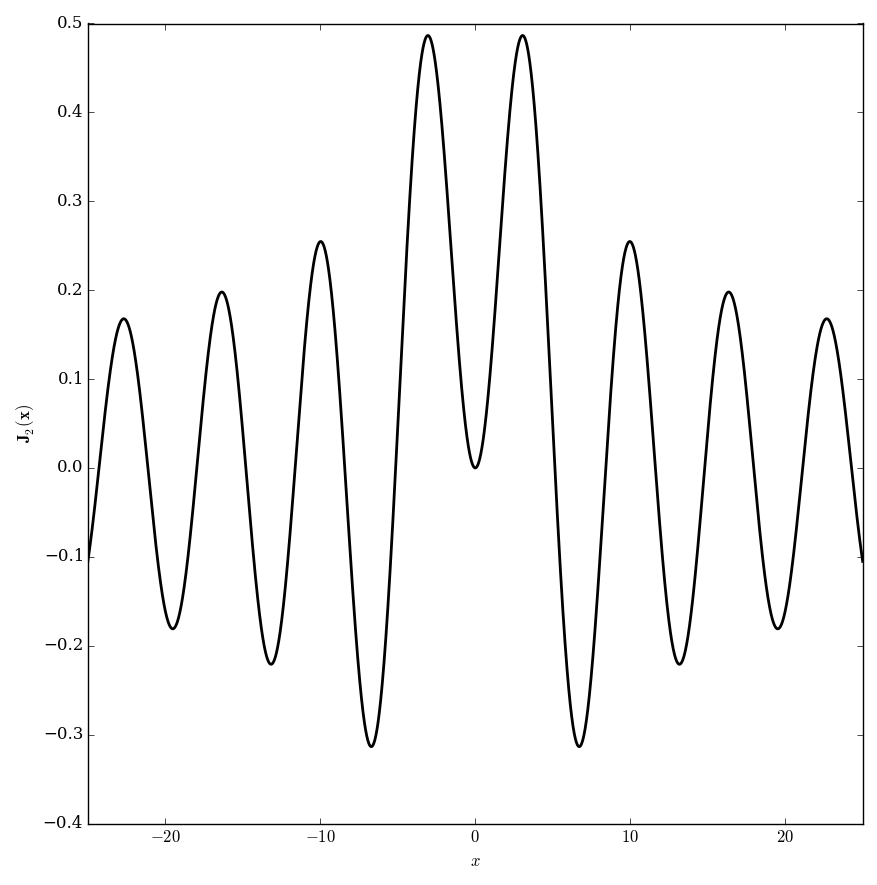
| 16:29, 23 May 2016 | Anger2plot.png (file) |  |
57 KB | Tom | Category:Plot <pre>#!/usr/bin/python import numpy as np import matplotlib.pyplot as plt from mpmath import * from pylab import rcParams rcParams['figure.figsize'] = 10, 10 x=np.arange(-25,25,0.01); def angerintegrand(t,n,x): return cos(n*t... | 1 |
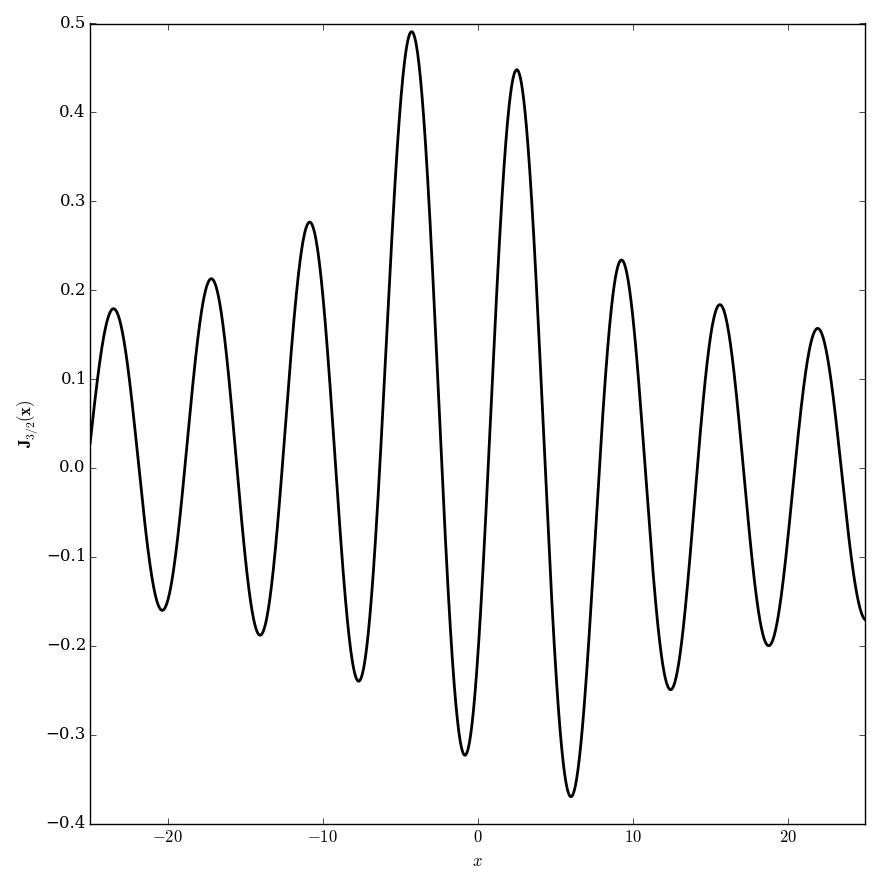
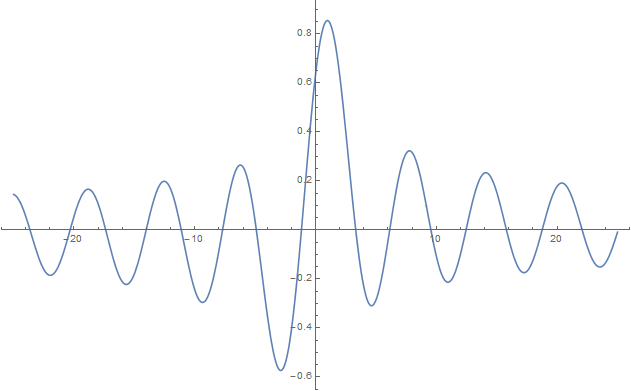
| 01:58, 10 August 2015 | Angerj.png (file) |  |
21 KB | Tom | Plot[AngerJ[1/2, x], {x, -25, 25}] | 1 |
| 01:54, 10 August 2015 | Angerjthumb.png (file) |  |
8 KB | Tom | 1 | |
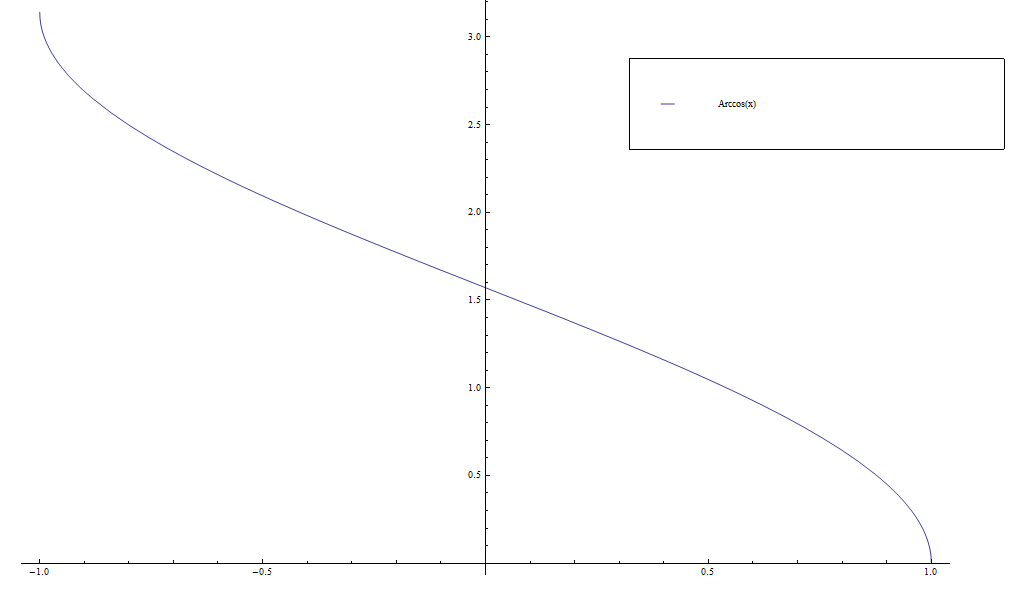
| 00:29, 19 October 2014 | Arccos.png (file) |  |
15 KB | Tom | 1 | |
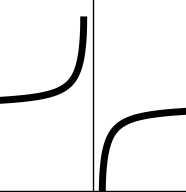
| 03:08, 26 February 2016 | Arccosecantglyph.png (file) |  |
4 KB | Tom | Category:Arccosecantglyph <pre>#!/usr/bin/python import numpy as np import matplotlib.pyplot as plt from mpmath import * from pylab import rcParams rcParams['figure.figsize'] = 2.4,2.4 x1=np.arange(1,10,0.001) x2=np.arange(-10,-1,0.001) f=np.vecto... | 1 |
| 23:02, 25 October 2014 | Arccosh.png (file) |  |
17 KB | Tom | 1 | |
| 18:43, 15 May 2016 | Arccoshglyph.png (file) |  |
4 KB | Tom | Category:Arccoshglyph <pre>#!/usr/bin/python import numpy as np import matplotlib.pyplot as plt from mpmath import * from pylab import rcParams rcParams['figure.figsize'] = 2.4,2.4 x=np.arange(1,4,0.001) f=np.vectorize(acosh) y=f(x) fig, ax = plt... | 1 |
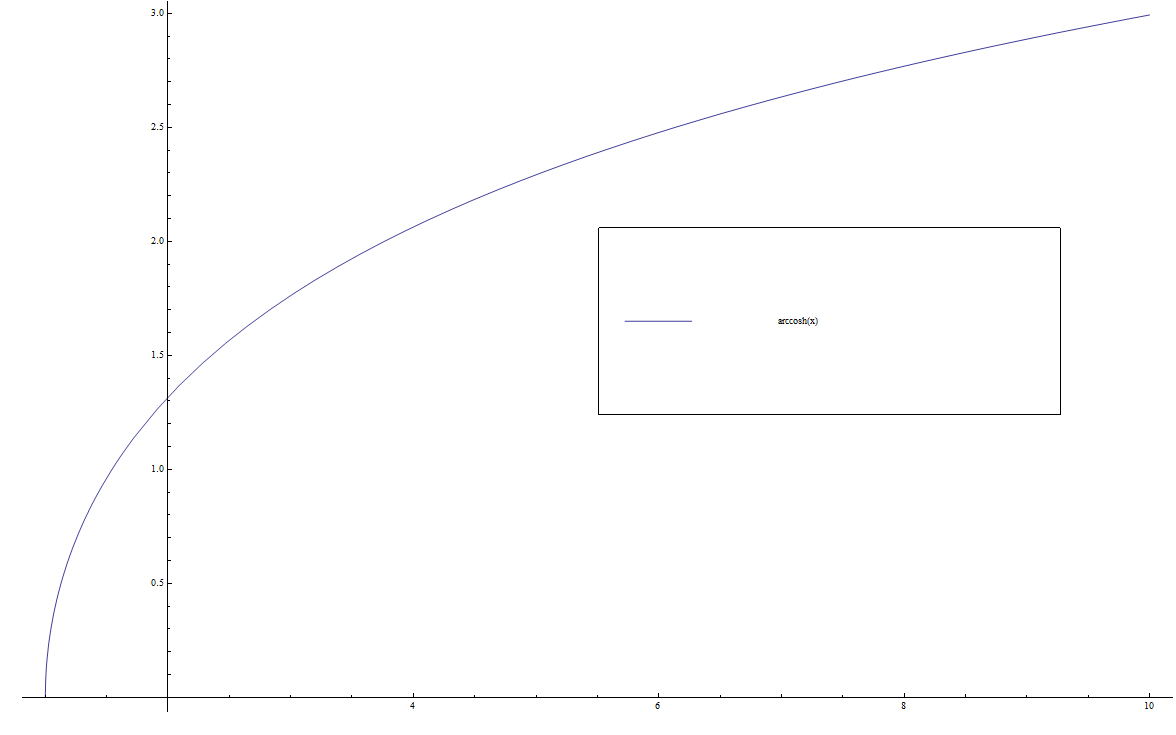
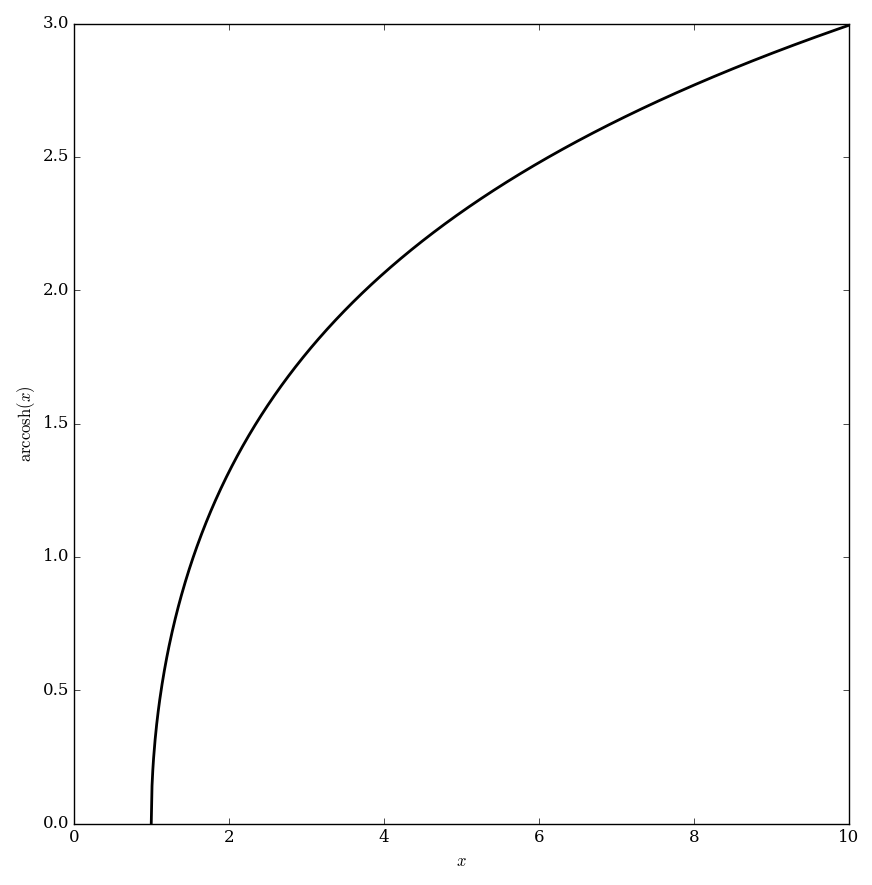
| 01:03, 22 June 2016 | Arccoshplot.png (file) |  |
31 KB | Tom | Category:Plot <pre>#!/usr/bin/python import numpy as np import matplotlib.pyplot as plt from mpmath import * from pylab import rcParams rcParams['figure.figsize'] = 10, 10 x=np.arange(1,10,0.01); f=np.vectorize(acosh) y=f(x) fig, ax = plt.subplot... | 1 |
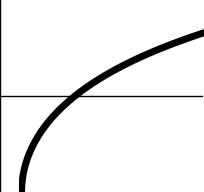
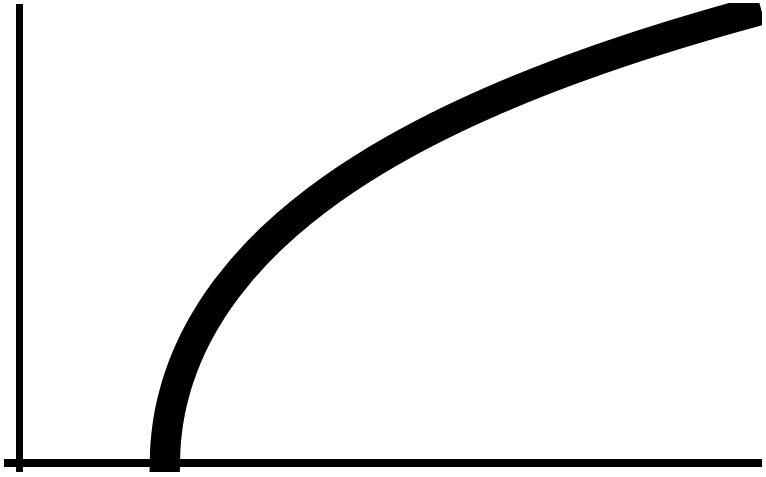
| 04:46, 19 January 2015 | Arccoshthumb.png (file) |  |
9 KB | Tom | Plot[ArcCosh[x], {x, 0, 5}, PlotStyle -> {Thickness[0.04], Black}, AxesStyle -> Thickness[0.01], Ticks -> None] | 1 |
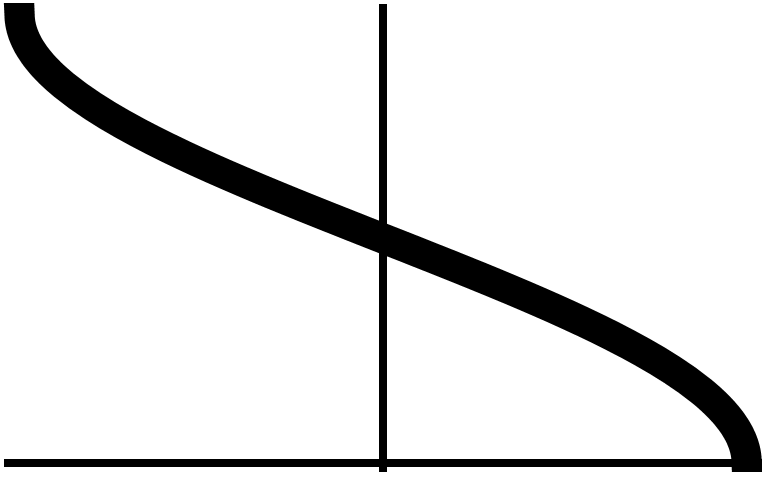
| 02:29, 26 February 2016 | Arccosineglyph.png (file) |  |
5 KB | Tom | Category:Arccosineglyph <pre>#!/usr/bin/python import numpy as np import matplotlib.pyplot as plt from mpmath import * from pylab import rcParams rcParams['figure.figsize'] = 2.4,2.4 x=np.arange(-1,1,0.001) f=np.vectorize(acos) y=f(x) fig, ax = p... | 1 |
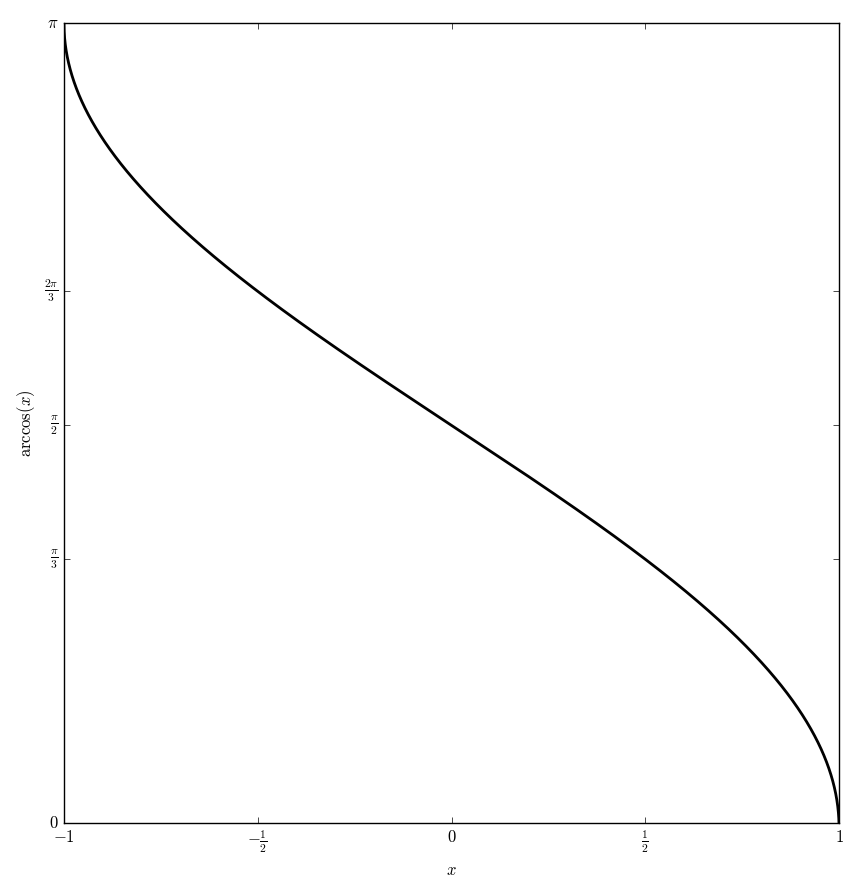
| 03:59, 16 May 2016 | Arccosplot.png (file) |  |
31 KB | Tom | Category:Plot <pre>#!/usr/bin/python import numpy as np import matplotlib.pyplot as plt from mpmath import * from pylab import rcParams rcParams['figure.figsize'] = 10, 10 x=np.arange(-1,1,0.0001); f=np.vectorize(acos) y=f(x) fig, ax = plt.subplo... | 1 |
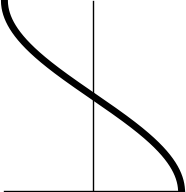
| 04:02, 19 January 2015 | Arccosthumb.png (file) |  |
11 KB | Tom | Plot[ArcCos[x], {x, -1, 1}, PlotStyle -> {Thickness[0.04], Black}, AxesStyle -> Thickness[0.01], Ticks -> None] | 1 |
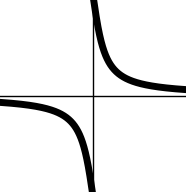
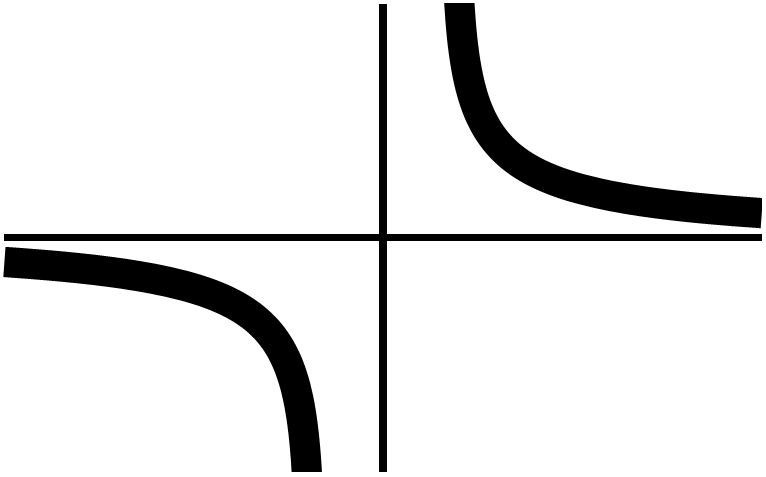
| 03:28, 26 February 2016 | Arccotangentglyph.png (file) |  |
4 KB | Tom | Category:Arccotangentglyph <pre>#!/usr/bin/python import numpy as np import matplotlib.pyplot as plt from mpmath import * from pylab import rcParams rcParams['figure.figsize'] = 2.4,2.4 x1=np.arange(-10,-0.000001,0.00001) x2=np.arange(0.000001,10,... | 1 |
| 06:03, 31 October 2014 | Arccoth.png (file) |  |
13 KB | Tom | 1 | |
| 18:45, 15 May 2016 | Arccothglyph.png (file) |  |
4 KB | Tom | Category:Arccothglyph <pre>#!/usr/bin/python import numpy as np import matplotlib.pyplot as plt from mpmath import * from pylab import rcParams rcParams['figure.figsize'] = 2.4,2.4 x1=np.arange(-4.5,-1.001,0.0001) x2=np.arange(1.001,4.5,0.0001) f=... | 1 |
| 04:50, 19 January 2015 | Arccoththumb.png (file) |  |
10 KB | Tom | Plot[ArcCoth[x], {x, -5, 5}, PlotStyle -> {Thickness[0.04], Black}, AxesStyle -> Thickness[0.01], Ticks -> None] | 1 |
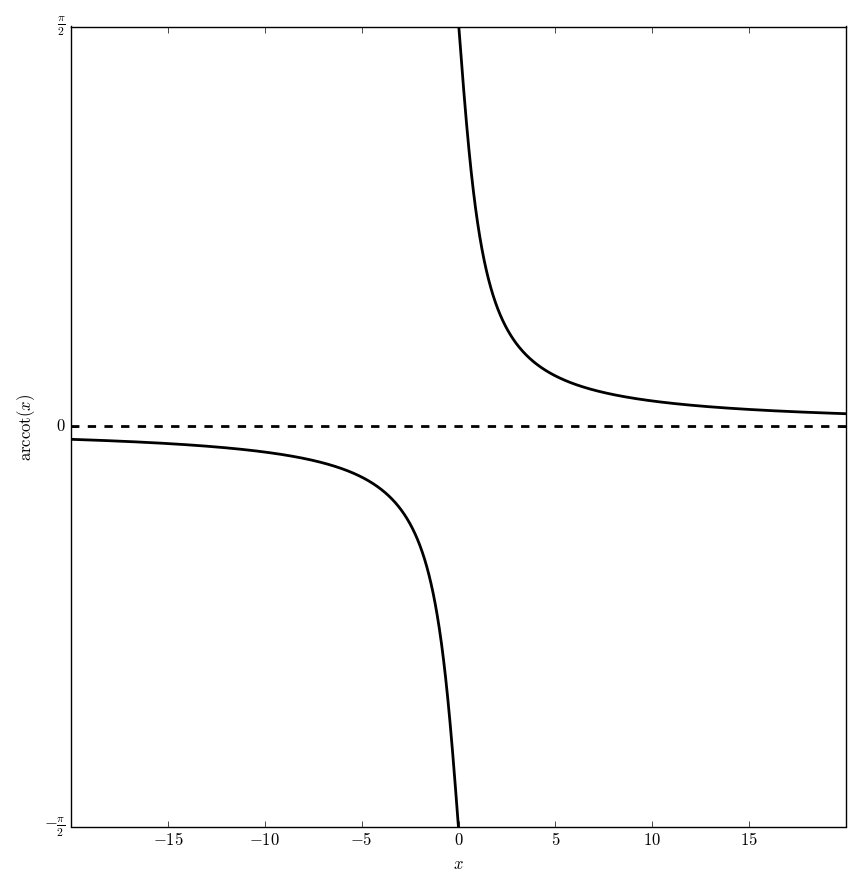
| 06:00, 16 May 2016 | Arccotplot.png (file) |  |
24 KB | Tom | Category:Plot <pre>#!/usr/bin/python import numpy as np import matplotlib.pyplot as plt from mpmath import * from pylab import rcParams rcParams['figure.figsize'] = 10, 10 x1=np.arange(-20,-0.01,0.0001); x2=np.arange(0.01,20,0.0001); x3=np.arange(... | 1 |
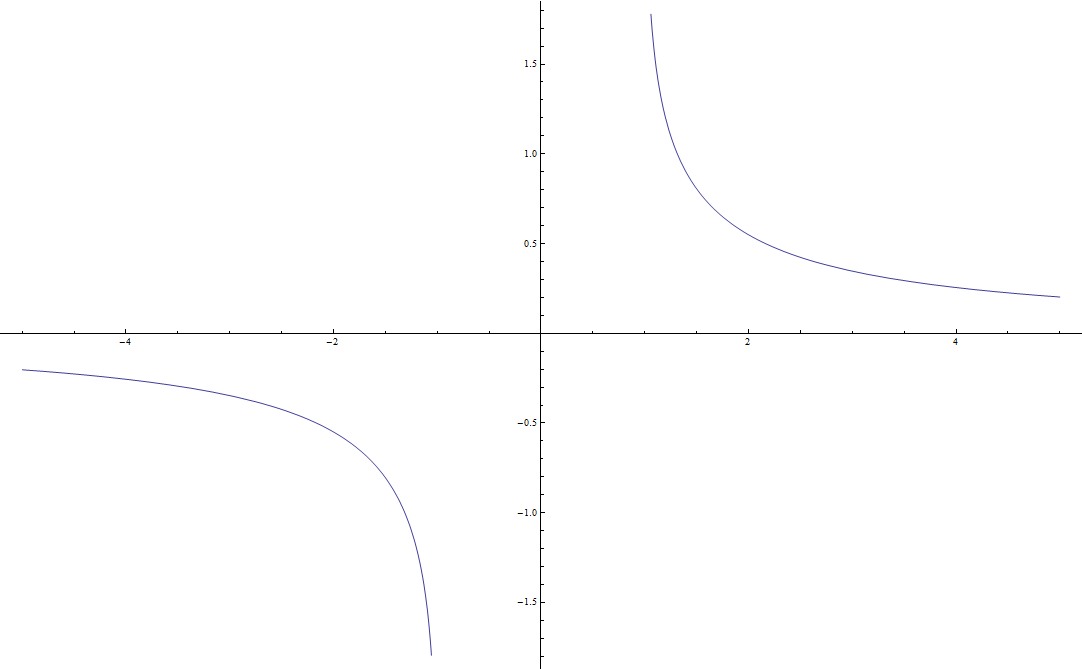
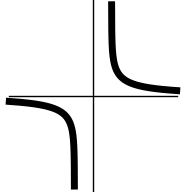
| 04:09, 19 January 2015 | Arccotthumb.png (file) |  |
11 KB | Tom | Plot[ArcCot[x], {x, -5, 5}, PlotStyle -> {Thickness[0.04], Black}, AxesStyle -> Thickness[0.01], Ticks -> None] | 1 |
| 18:44, 15 May 2016 | Arccschglyph.png (file) |  |
5 KB | Tom | Category:Arccschglyph <pre>#!/usr/bin/python import numpy as np import matplotlib.pyplot as plt from mpmath import * from pylab import rcParams rcParams['figure.figsize'] = 2.4,2.4 x=np.arange(-1,1,0.03) f=np.vectorize(acsch) y=f(x) fig, ax = plt... | 1 |
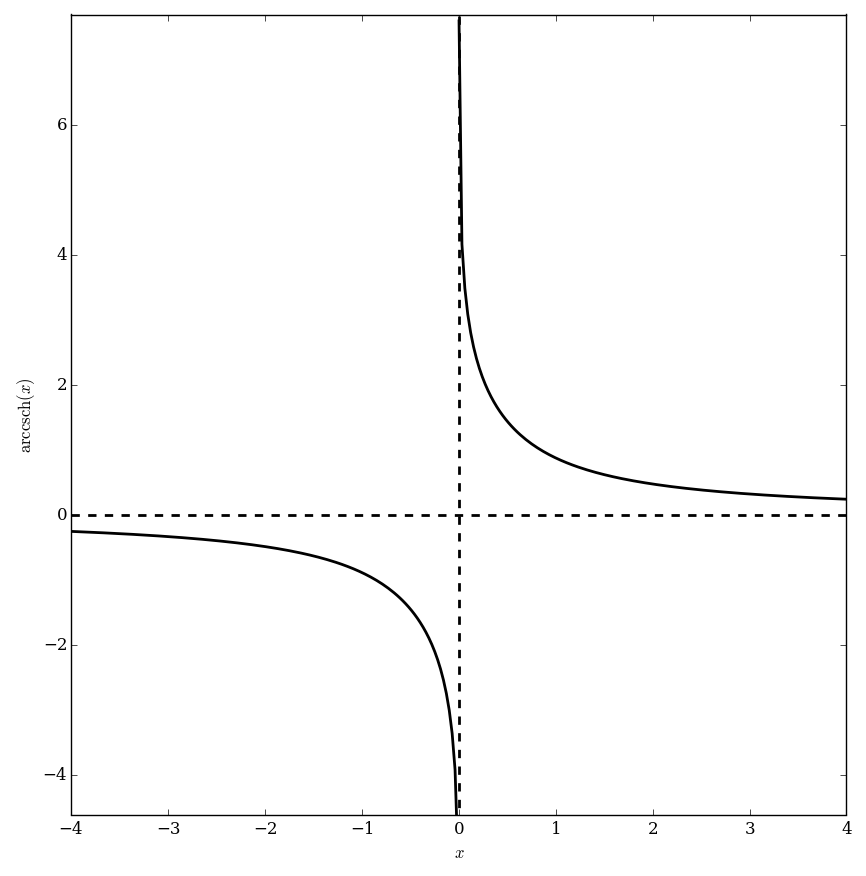
| 21:55, 24 May 2016 | Arccschplot.png (file) |  |
29 KB | Tom | Category:Plot <pre>#!/usr/bin/python import numpy as np import matplotlib.pyplot as plt from mpmath import * from pylab import rcParams rcParams['figure.figsize'] = 10, 10 x1=np.arange(-4,-0.0001,0.03); x2=np.arange(0.001,4,0.03); x3=np.arange(-5,... | 1 |
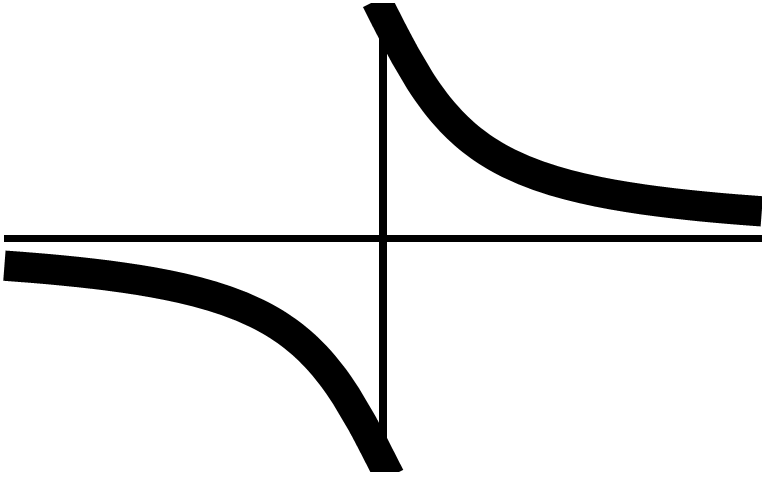
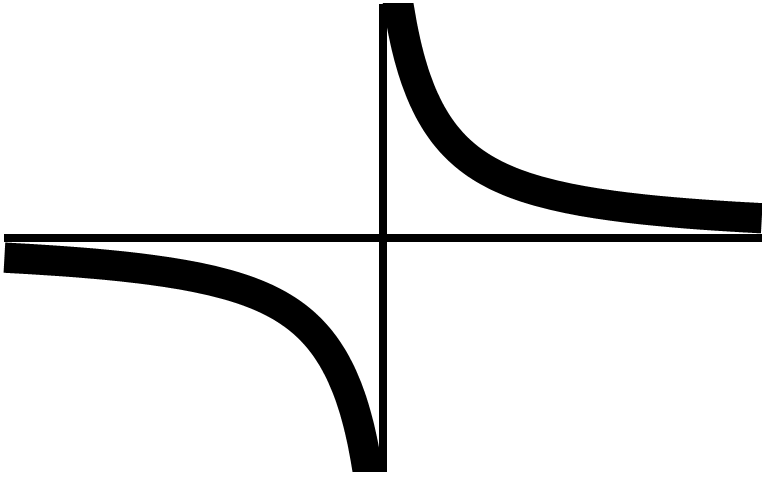
| 04:48, 19 January 2015 | Arccschthumb.png (file) |  |
10 KB | Tom | Plot[ArcCsch[x], {x, -5, 5}, PlotStyle -> {Thickness[0.04], Black}, AxesStyle -> Thickness[0.01], Ticks -> None] | 1 |
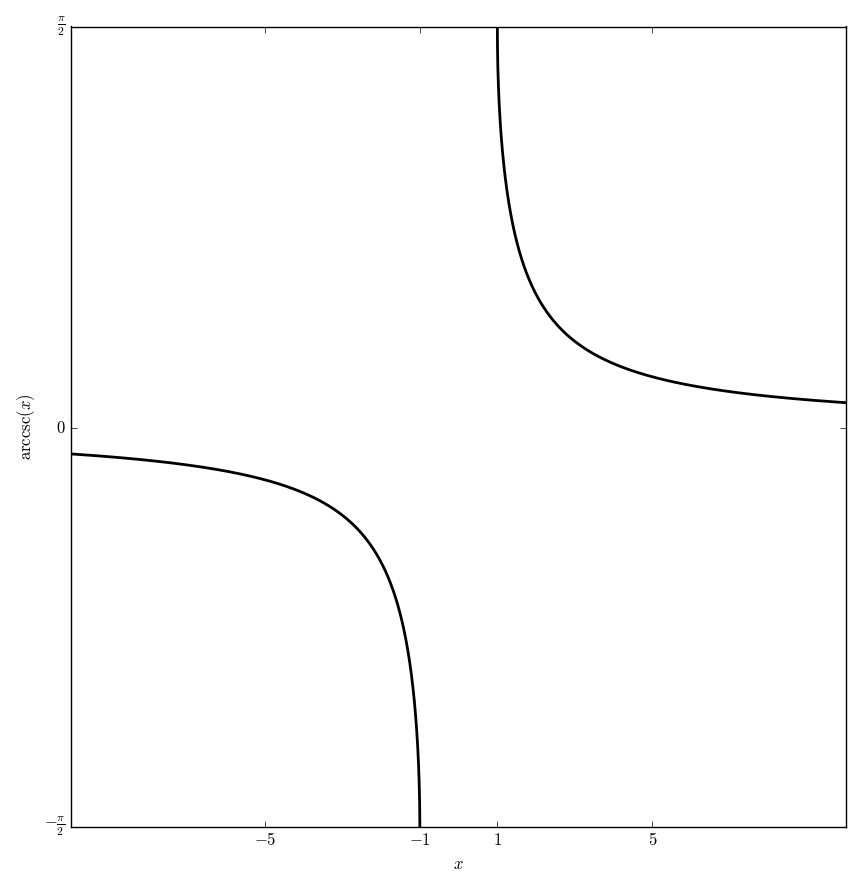
| 04:39, 16 May 2016 | Arccscplot.png (file) |  |
24 KB | Tom | Category:Plot <pre>#!/usr/bin/python import numpy as np import matplotlib.pyplot as plt from mpmath import * from pylab import rcParams rcParams['figure.figsize'] = 10, 10 x1=np.arange(-10,-1,0.0001); x2=np.arange(1,10,0.0001); f=np.vectorize(acsc... | 1 |
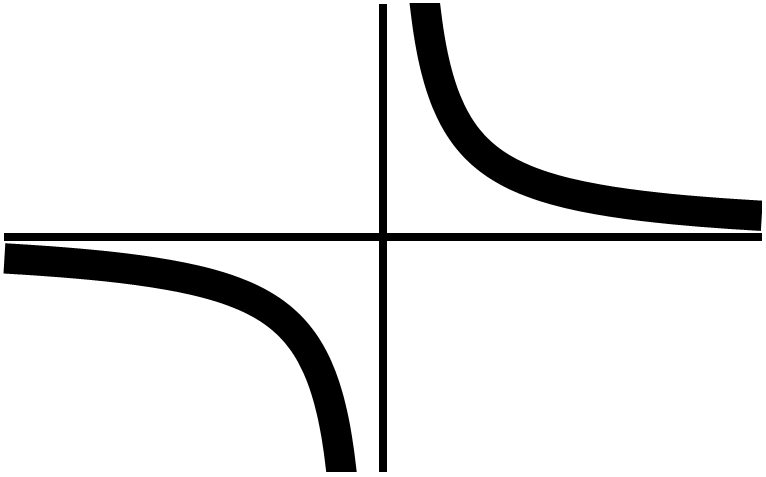
| 04:06, 19 January 2015 | Arccscthumb.png (file) |  |
10 KB | Tom | Plot[ArcCsc[x], {x, -10, 10}, PlotStyle -> {Thickness[0.04], Black}, AxesStyle -> Thickness[0.01], Ticks -> None] | 1 |
| 03:20, 26 February 2016 | Arcsecantglyph.png (file) |  |
4 KB | Tom | Category:Arcsecantglyph <pre>#!/usr/bin/python import numpy as np import matplotlib.pyplot as plt from mpmath import * from pylab import rcParams rcParams['figure.figsize'] = 2.4,2.4 x1=np.arange(1,10,0.00001) x2=np.arange(-10,-1,0.00001) #x=np.co... | 1 |
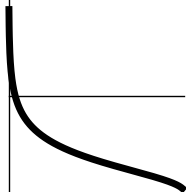
| 18:45, 15 May 2016 | Arcsechglyph.png (file) |  |
4 KB | Tom | Category:Arcsechglyph <pre>#!/usr/bin/python import numpy as np import matplotlib.pyplot as plt from mpmath import * from pylab import rcParams rcParams['figure.figsize'] = 2.4,2.4 x=np.arange(0.001,0.99,0.001) f=np.vectorize(asech) y=f(x) fig, a... | 1 |
| 22:12, 24 May 2016 | Arcsechplot.png (file) |  |
29 KB | Tom | Category:Plot <pre>#!/usr/bin/python import numpy as np import matplotlib.pyplot as plt from mpmath import * from pylab import rcParams rcParams['figure.figsize'] = 10, 10 x=np.arange(0.0001,0.999,0.00001); f=np.vectorize(asech) y=f(x) x2=np.arang... | 1 |
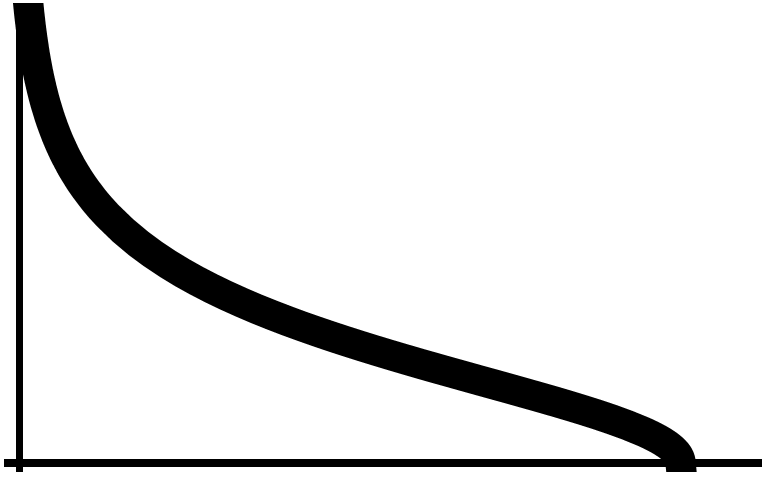
| 04:50, 19 January 2015 | Arcsechthumb.png (file) |  |
9 KB | Tom | Plot[ArcSech[x], {x, 0, 1.1}, PlotStyle -> {Thickness[0.04], Black}, AxesStyle -> Thickness[0.01], Ticks -> None] | 1 |
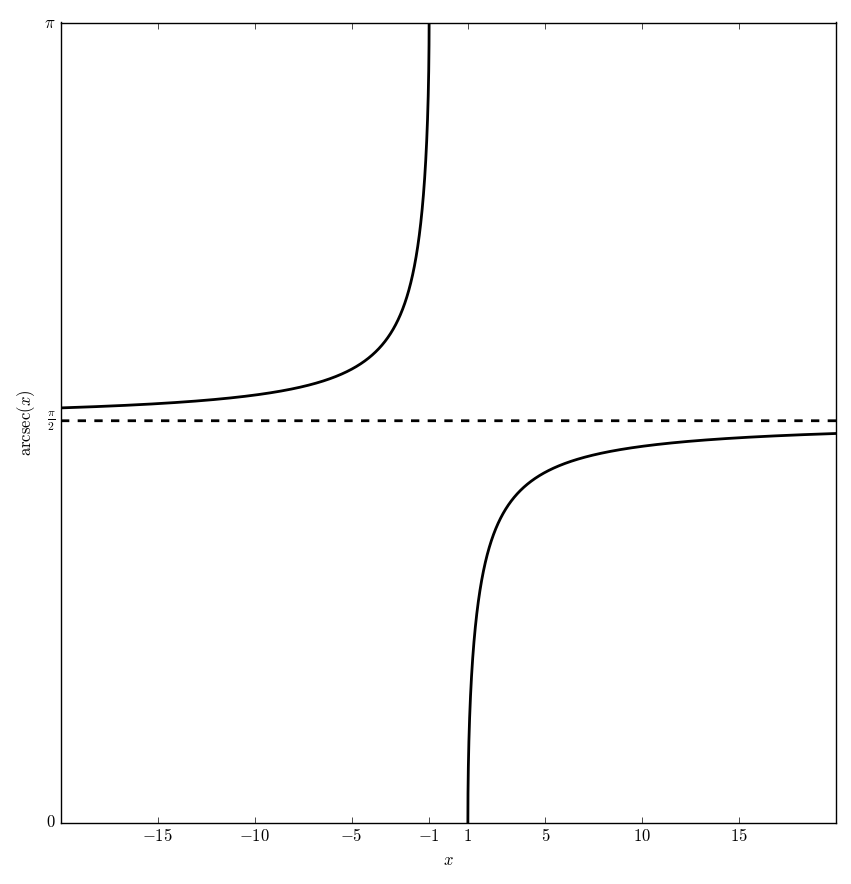
| 05:17, 16 May 2016 | Arcsecplot.png (file) |  |
21 KB | Tom | Category:Plot <pre>#!/usr/bin/python import numpy as np import matplotlib.pyplot as plt from mpmath import * from pylab import rcParams rcParams['figure.figsize'] = 10, 10 x1=np.arange(-20,-1,0.0001); x2=np.arange(1,20,0.0001); x3=np.arange(-20,20... | 1 |
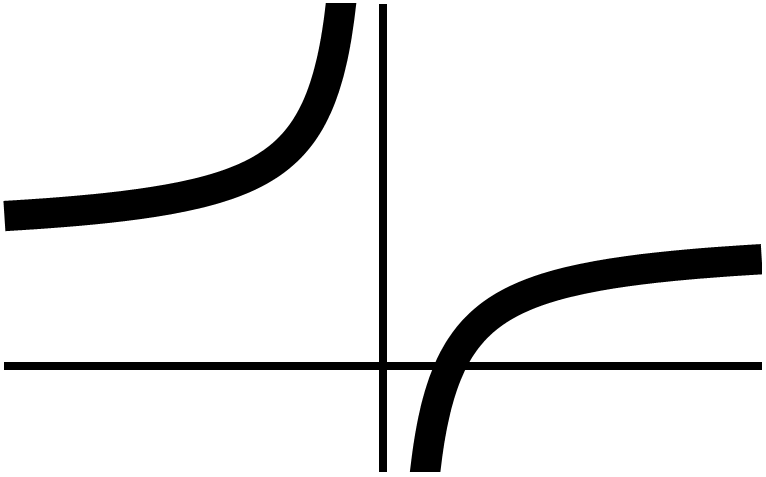
| 04:07, 19 January 2015 | Arcsecthumb.png (file) |  |
9 KB | Tom | Plot[ArcSec[x], {x, -10, 10}, PlotStyle -> {Thickness[0.04], Black}, AxesStyle -> Thickness[0.01], Ticks -> None] | 1 |
| 02:14, 26 February 2016 | Arcsineglyph.png (file) |  |
5 KB | Tom | Category:Arcsineglyph <pre>#!/usr/bin/python import numpy as np import matplotlib.pyplot as plt from mpmath import * from pylab import rcParams rcParams['figure.figsize'] = 2.4,2.4 x=np.arange(-1,1,0.00001) f=np.vectorize(asin) y=f(x) fig, ax = p... | 1 |
| 18:41, 15 May 2016 | Arcsinhglyph.png (file) |  |
5 KB | Tom | Category:Arcsinhglyph <pre>#!/usr/bin/python import numpy as np import matplotlib.pyplot as plt from mpmath import * from pylab import rcParams rcParams['figure.figsize'] = 2.4,2.4 x=np.arange(-6,6,0.001) f=np.vectorize(asinh) y=f(x) fig, ax = pl... | 1 |
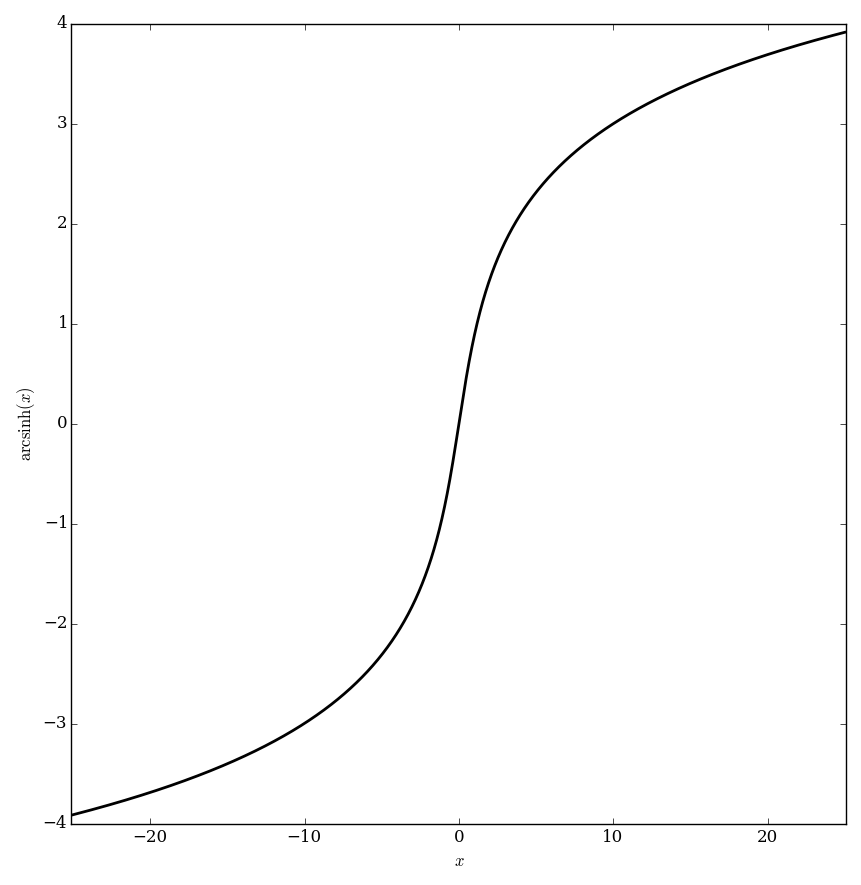
| 01:01, 22 June 2016 | Arcsinhplot.png (file) |  |
30 KB | Tom | Category:Plot <pre>#!/usr/bin/python import numpy as np import matplotlib.pyplot as plt from mpmath import * from pylab import rcParams rcParams['figure.figsize'] = 10, 10 x=np.arange(-25,25,0.01); f=np.vectorize(asinh) y=f(x) fig, ax = plt.subpl... | 2 |
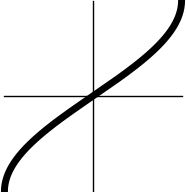
| 04:45, 19 January 2015 | Arcsinhthumb.png (file) |  |
10 KB | Tom | Plot[ArcSinh[x], {x, -5, 5}, PlotStyle -> {Thickness[0.04], Black}, AxesStyle -> Thickness[0.01], Ticks -> None] | 1 |
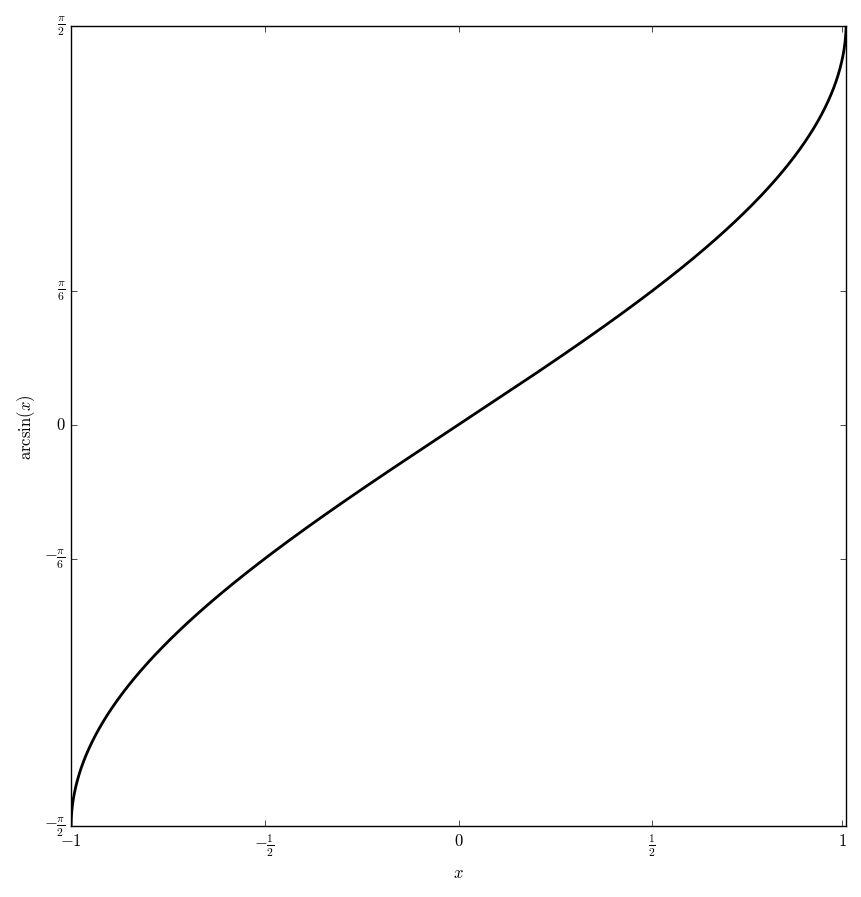
| 03:51, 16 May 2016 | Arcsinplot.png (file) |  |
29 KB | Tom | Category:Plot <pre>#!/usr/bin/python import numpy as np import matplotlib.pyplot as plt from mpmath import * from pylab import rcParams rcParams['figure.figsize'] = 10, 10 x=np.arange(-1,1,0.0001); f=np.vectorize(asin) y=f(x) fig, ax = plt.subplo... | 1 |
| 04:03, 19 January 2015 | Arcsinthumb.png (file) |  |
10 KB | Tom | Plot[ArcSin[x], {x, -1, 1}, PlotStyle -> {Thickness[0.04], Black}, AxesStyle -> Thickness[0.01], Ticks -> None] | 1 |
First page |
Previous page |
Next page |
Last page |