File list
This special page shows all uploaded files.
First page |
Previous page |
Next page |
Last page |
| Date | Name | Thumbnail | Size | User | Description | Versions |
|---|---|---|---|---|---|---|
| 10:59, 19 January 2015 | Cantor function.gif (file) |  |
60 KB | Tom | From [http://en.wikipedia.org/wiki/Cantor_function#mediaviewer/File:Cantor_function.gif here] | 1 |
| 11:13, 19 January 2015 | Riemannzetathumb.png (file) | 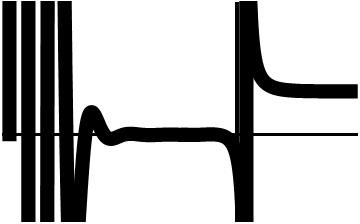 |
4 KB | Tom | Plot[Zeta[x], {x, -24, 12}, PlotStyle -> {Thickness[0.04], Black}, AxesStyle -> Thickness[0.01], Ticks -> None] | 1 |
| 11:16, 19 January 2015 | Jacobizetathumb.png (file) | 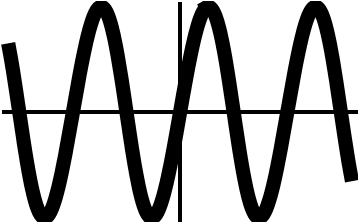 |
8 KB | Tom | Plot[JacobiZeta[x, 0.5], {x, -5, 5}, PlotStyle -> {Thickness[0.04], Black}, AxesStyle -> Thickness[0.01], Ticks -> None] | 1 |
| 11:18, 19 January 2015 | Weierstrasszetathumb.png (file) | 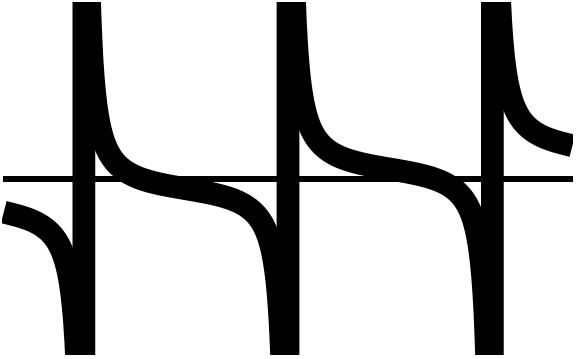 |
9 KB | Tom | Plot[WeierstrassZeta[x, {1, 2}], {x, -3.5, 3.5}, PlotStyle -> {Thickness[0.04], Black}, AxesStyle -> Thickness[0.01], Ticks -> None] | 1 |
| 11:23, 19 January 2015 | Hurwitzzetathumb.png (file) | 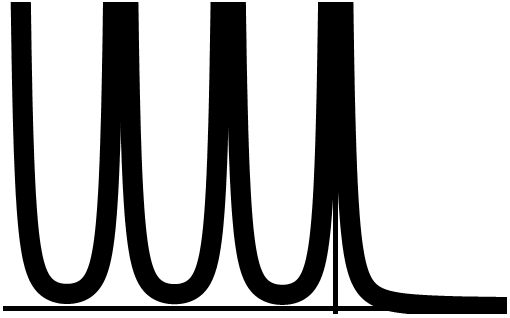 |
9 KB | Tom | Plot[HurwitzZeta[2, x], {x, -3, 1.5}, PlotStyle -> {Thickness[0.04], Black}, AxesStyle -> Thickness[0.01], Ticks -> None] | 1 |
| 11:41, 19 January 2015 | Primezetapthumb.png (file) | 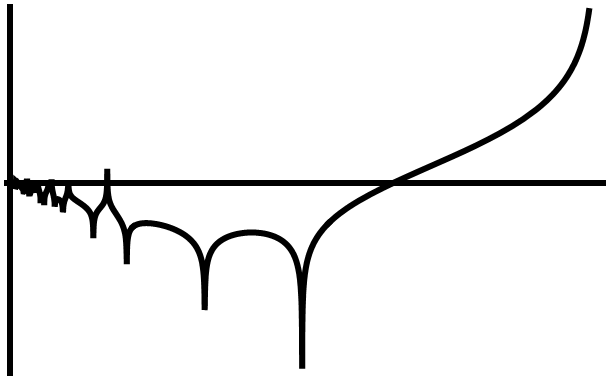 |
10 KB | Tom | Plot[Re[PrimeZetaP[x]], {x, 0.01, 1}, PlotStyle -> {Thickness[0.01], Black}, AxesStyle -> Thickness[0.01], Ticks -> None] | 1 |
| 11:46, 19 January 2015 | Mangoldtthumb.png (file) | 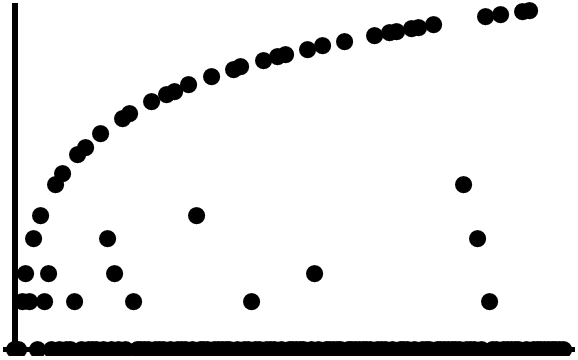 |
8 KB | Tom | DiscretePlot[MangoldtLambda[k], {k, 0, 148}, PlotStyle -> {PointSize[0.03], Black}, FillingStyle -> None, AxesStyle -> Thickness[0.01], AxesStyle -> Thickness[0.01], Ticks -> None] | 1 |
| 11:50, 19 January 2015 | Möbiusthumb.png (file) | 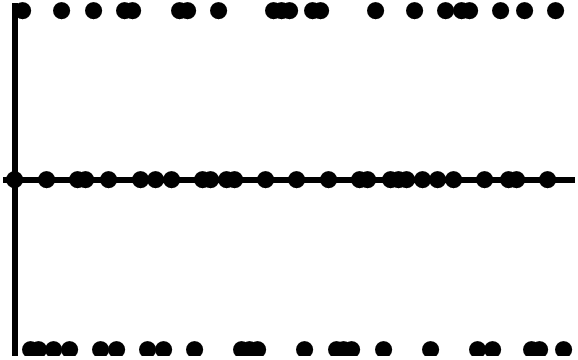 |
4 KB | Tom | DiscretePlot[MoebiusMu[k], {k, 0, 70}, PlotStyle -> {PointSize[0.03], Black}, FillingStyle -> None, AxesStyle -> Thickness[0.01], AxesStyle -> Thickness[0.01], Ticks -> None] | 1 |
| 11:52, 19 January 2015 | Eulerphithumb.png (file) | 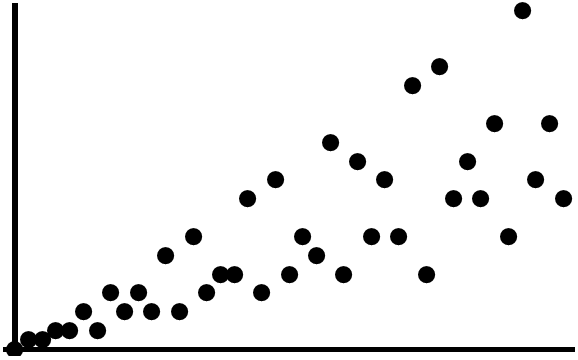 |
6 KB | Tom | DiscretePlot[EulerPhi[k], {k, 0, 40}, PlotStyle -> {PointSize[0.03], Black}, FillingStyle -> None, AxesStyle -> Thickness[0.01], AxesStyle -> Thickness[0.01], Ticks -> None] | 1 |
| 11:57, 19 January 2015 | Divisorsumthumb.png (file) | 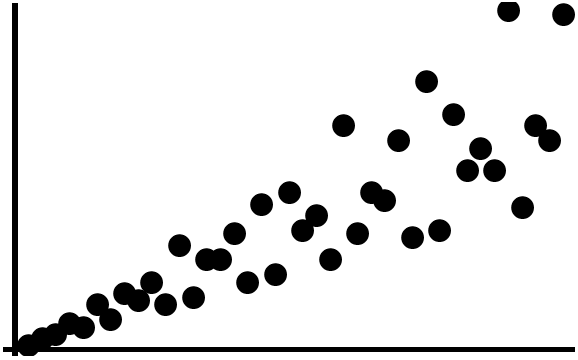 |
9 KB | Tom | DiscretePlot[DivisorSum[k, # &], {k, 40}, PlotStyle -> {PointSize[0.04], Black}, FillingStyle -> None, AxesStyle -> Thickness[0.01], AxesStyle -> Thickness[0.01], Ticks -> None] | 1 |
| 11:59, 19 January 2015 | Primepithumb.png (file) | 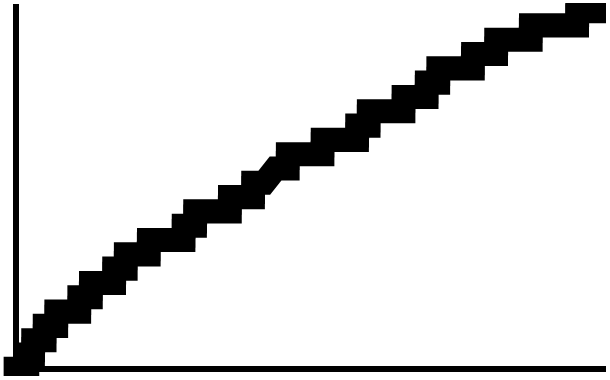 |
4 KB | Tom | Plot[PrimePi[x], {x, 0, 100}, PlotStyle -> {Thickness[0.04], Black}, AxesStyle -> Thickness[0.01], Ticks -> None] | 1 |
| 12:06, 19 January 2015 | Mertensthumb.png (file) | 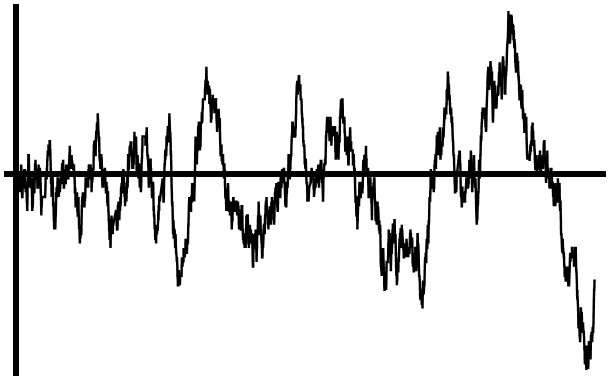 |
16 KB | Tom | Mertens[n_] := Sum[MoebiusMu[k], {k, 1, n}] Plot[Mertens[x], {x, 0, 10000}, PlotStyle -> {Thickness[0.004], Black}, AxesStyle -> Thickness[0.01], Ticks -> None] | 1 |
| 12:09, 19 January 2015 | Liouvillelambdathumb.png (file) | 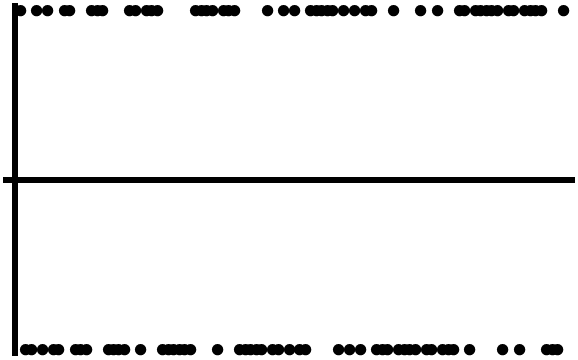 |
4 KB | Tom | DiscretePlot[LiouvilleLambda[k], {k, 100}, PlotStyle -> {PointSize[0.02], Black}, FillingStyle -> None, AxesStyle -> Thickness[0.01], AxesStyle -> Thickness[0.01], Ticks -> None] | 2 |
| 12:17, 19 January 2015 | Barnesgthumb.png (file) | 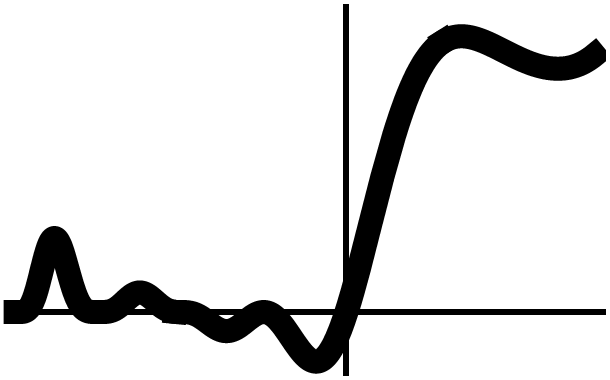 |
10 KB | Tom | Plot[BarnesG[x], {x, -4, 3}, PlotStyle -> {Thickness[0.04], Black}, AxesStyle -> Thickness[0.01], Ticks -> None, PlotRange -> {-1/4, 1.2}] | 1 |
| 12:20, 19 January 2015 | Hyperfactorialthumb.png (file) | 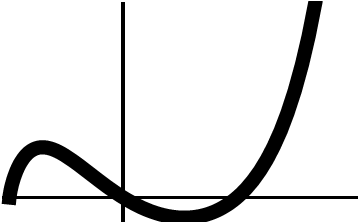 |
5 KB | Tom | Plot[Hyperfactorial[x], {x, -1, 2}, PlotStyle -> {Thickness[0.04], Black}, AxesStyle -> Thickness[0.01], Ticks -> None] | 1 |
| 12:24, 19 January 2015 | Incompletegammathumb.png (file) | 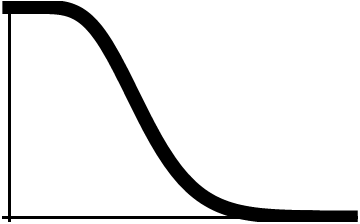 |
4 KB | Tom | Plot[Gamma[10, x], {x, 0, 25}, PlotStyle -> {Thickness[0.04], Black}, AxesStyle -> Thickness[0.01], Ticks -> None] | 1 |
| 12:31, 19 January 2015 | Ramanujantauthumb.png (file) | 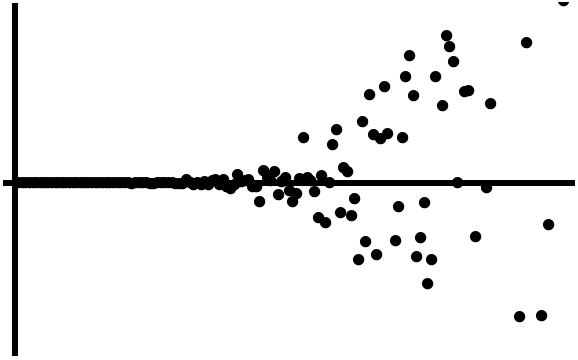 |
7 KB | Tom | DiscretePlot[RamanujanTau[k], {k, 150}, PlotStyle -> {PointSize[0.02], Black}, FillingStyle -> None, AxesStyle -> Thickness[0.01], AxesStyle -> Thickness[0.01], Ticks -> None] | 1 |
| 12:35, 19 January 2015 | Riemannsiegelzthumb.png (file) | 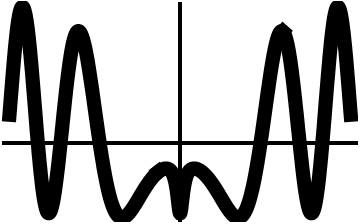 |
9 KB | Tom | Plot[RiemannSiegelZ[x], {x, -30, 30}, PlotStyle -> {Thickness[0.04], Black}, AxesStyle -> Thickness[0.01], Ticks -> None] | 1 |
| 12:45, 19 January 2015 | Elliptickthumb.png (file) | 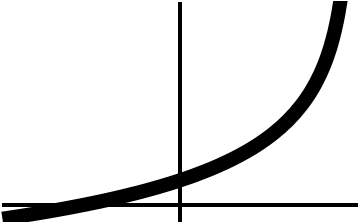 |
4 KB | Tom | Plot[EllipticK[x], {x, -1, 1}, PlotStyle -> {Thickness[0.04], Black}, AxesStyle -> Thickness[0.01], Ticks -> None] | 1 |
| 12:46, 19 January 2015 | Ellipticethumb.png (file) | 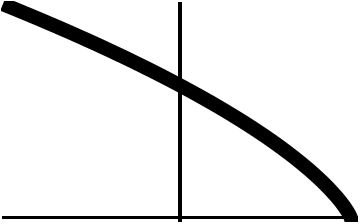 |
5 KB | Tom | Plot[EllipticE[x], {x, -1, 1}, PlotStyle -> {Thickness[0.04], Black}, AxesStyle -> Thickness[0.01], Ticks -> None] | 1 |
| 12:48, 19 January 2015 | Weierstrasspthumb.png (file) | 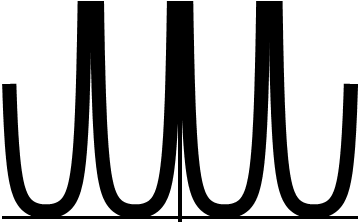 |
6 KB | Tom | Plot[WeierstrassP[x, {1, 2}], {x, -5, 5}, PlotStyle -> {Thickness[0.04], Black}, AxesStyle -> Thickness[0.01], Ticks -> None] | 1 |
| 12:55, 19 January 2015 | Jacobicnthumb.png (file) |  |
8 KB | Tom | Plot[JacobiCN[x, 1/3], {x, -10, 10}, PlotStyle -> {Thickness[0.04], Black}, AxesStyle -> Thickness[0.01], Ticks -> None] | 1 |
| 12:55, 19 January 2015 | Jacobicdthumb.png (file) |  |
8 KB | Tom | Plot[JacobiCD[x, 1/3], {x, -10, 10}, PlotStyle -> {Thickness[0.04], Black}, AxesStyle -> Thickness[0.01], Ticks -> None] | 1 |
| 12:56, 19 January 2015 | Jacobicsthumb.png (file) |  |
6 KB | Tom | Plot[JacobiCS[x, 1/3], {x, -5, 5}, PlotStyle -> {Thickness[0.04], Black}, AxesStyle -> Thickness[0.01], Ticks -> None] | 1 |
| 12:57, 19 January 2015 | Jacobidcthumb.png (file) |  |
5 KB | Tom | Plot[JacobiDC[x, 1/3], {x, -7, 7}, PlotStyle -> {Thickness[0.04], Black}, AxesStyle -> Thickness[0.01], Ticks -> None] | 1 |
| 12:57, 19 January 2015 | Jacobidnthumb.png (file) |  |
8 KB | Tom | Plot[JacobiDN[x, 1/3], {x, -7, 7}, PlotStyle -> {Thickness[0.04], Black}, AxesStyle -> Thickness[0.01], Ticks -> None] | 1 |
| 12:58, 19 January 2015 | Jacobidsthumb.png (file) |  |
5 KB | Tom | Plot[JacobiDS[x, 1/3], {x, -7, 7}, PlotStyle -> {Thickness[0.04], Black}, AxesStyle -> Thickness[0.01], Ticks -> None] | 1 |
| 12:58, 19 January 2015 | Jacobincthumb.png (file) |  |
5 KB | Tom | Plot[JacobiNC[x, 1/3], {x, -7, 7}, PlotStyle -> {Thickness[0.04], Black}, AxesStyle -> Thickness[0.01], Ticks -> None] | 1 |
| 12:58, 19 January 2015 | Jacobindthumb.png (file) |  |
8 KB | Tom | Plot[JacobiND[x, 1/3], {x, -7, 7}, PlotStyle -> {Thickness[0.04], Black}, AxesStyle -> Thickness[0.01], Ticks -> None] | 1 |
| 12:59, 19 January 2015 | Jacobiscthumb.png (file) |  |
6 KB | Tom | Plot[JacobiSC[x, 1/3], {x, -7, 7}, PlotStyle -> {Thickness[0.04], Black}, AxesStyle -> Thickness[0.01], Ticks -> None] | 1 |
| 12:59, 19 January 2015 | Jacobisdthumb.png (file) |  |
7 KB | Tom | Plot[JacobiSD[x, 1/3], {x, -7, 7}, PlotStyle -> {Thickness[0.04], Black}, AxesStyle -> Thickness[0.01], Ticks -> None] | 1 |
| 13:00, 19 January 2015 | Jacobisnthumb.png (file) |  |
7 KB | Tom | Plot[JacobiSN[x, 1/3], {x, -7, 7}, PlotStyle -> {Thickness[0.04], Black}, AxesStyle -> Thickness[0.01], Ticks -> None] | 1 |
| 13:03, 19 January 2015 | Kleininvariantjthumb.png (file) | 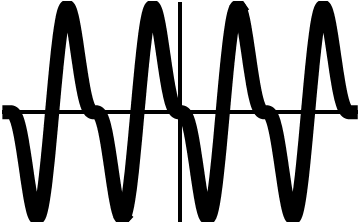 |
8 KB | Tom | Plot[Im[KleinInvariantJ[x + I]], {x, -2, 2}, PlotStyle -> {Thickness[0.04], Black}, AxesStyle -> Thickness[0.01], Ticks -> None] | 1 |
| 13:07, 19 January 2015 | Modularlambdathumb.png (file) | 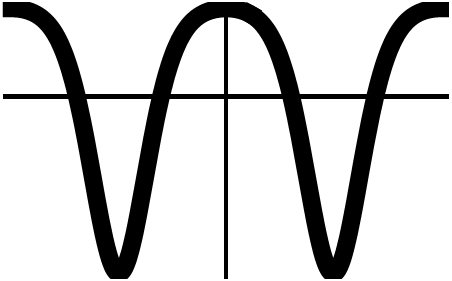 |
8 KB | Tom | Plot[Re[ModularLambda[x + I]], {x, -2, 2}, PlotStyle -> {Thickness[0.04], Black}, AxesStyle -> Thickness[0.01], Ticks -> None] | 1 |
| 13:09, 19 January 2015 | Ellipticthetathumb.png (file) | 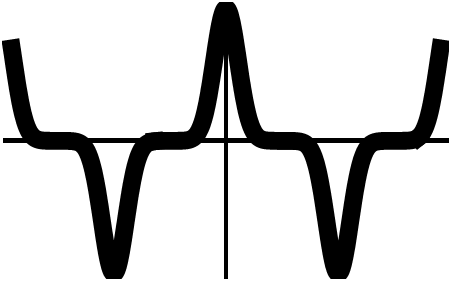 |
8 KB | Tom | Plot[EllipticTheta[2, x, 4/5], {x, -6, 6}, PlotStyle -> {Thickness[0.04], Black}, AxesStyle -> Thickness[0.01], Ticks -> None] | 1 |
| 13:16, 19 January 2015 | Pochhammerthumb.png (file) | 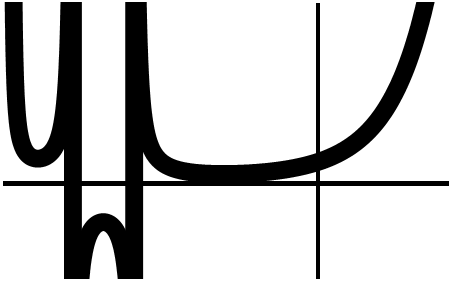 |
7 KB | Tom | Plot[Pochhammer[3, x], {x, -5, 2}, PlotStyle -> {Thickness[0.04], Black}, AxesStyle -> Thickness[0.01], Ticks -> None, PlotPoints -> 200] | 1 |
| 16:55, 19 February 2015 | Lambertwthumb.png (file) | 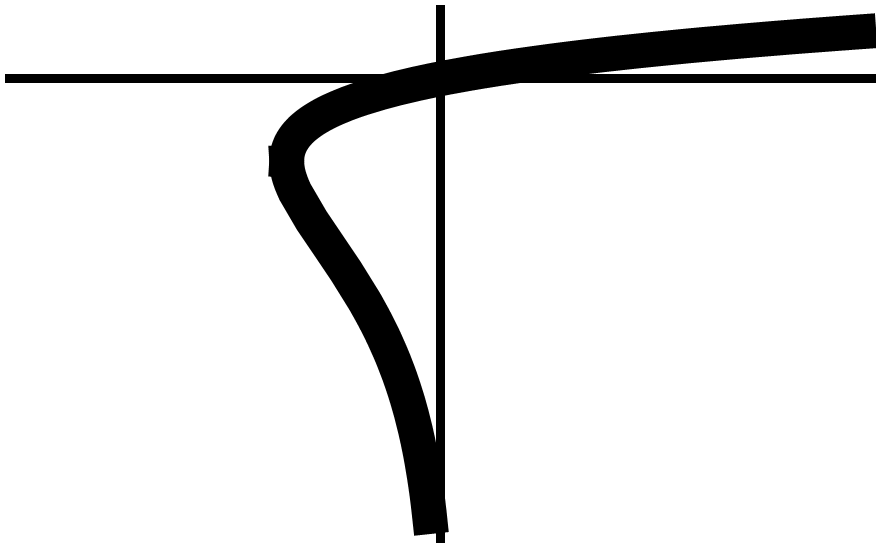 |
10 KB | Tom | Plot[{ProductLog[x], ProductLog[-1, x]}, {x, -1, 1}, PlotStyle -> {{Thickness[0.04], Black}, {Thickness[0.04], Black}}, AxesStyle -> Thickness[0.01], Ticks -> None] | 1 |
| 17:19, 19 February 2015 | Lambertwplot.png (file) | 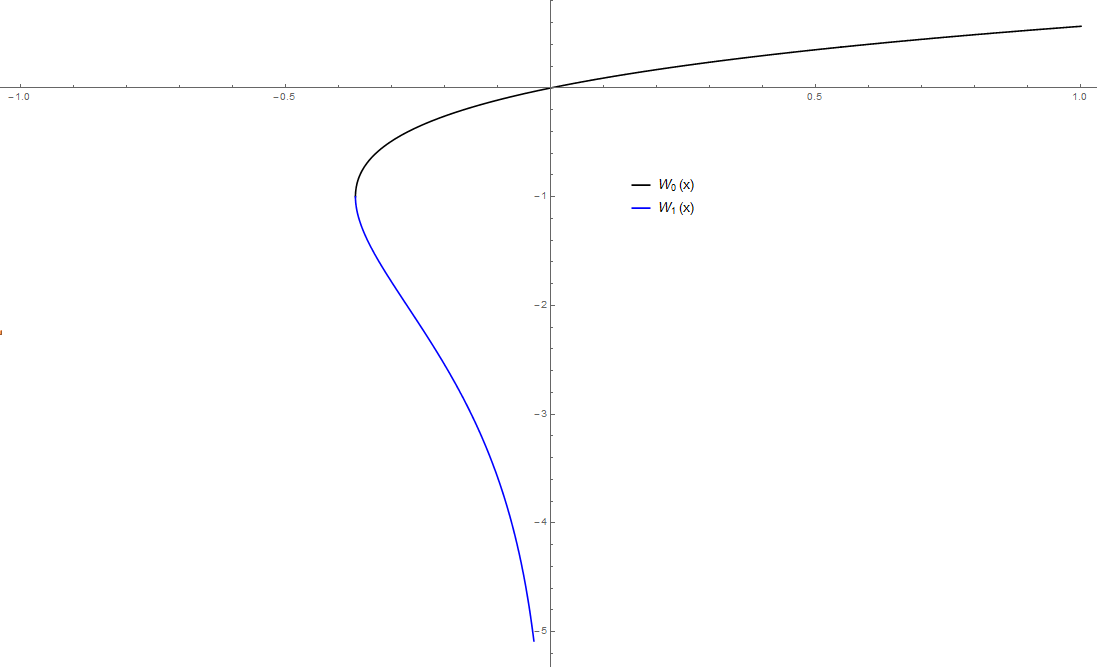 |
13 KB | Tom | Plot[{ProductLog[x], ProductLog[-1, x]}, {x, -1, 1}, PlotStyle -> {Black, Blue}, PlotPoints -> 1000, PlotLegends -> {Subscript[W, 0] "(x)", Subscript[W, 1] "(x)"}] | 1 |
| 20:30, 19 February 2015 | Complexlambertw0.png (file) | 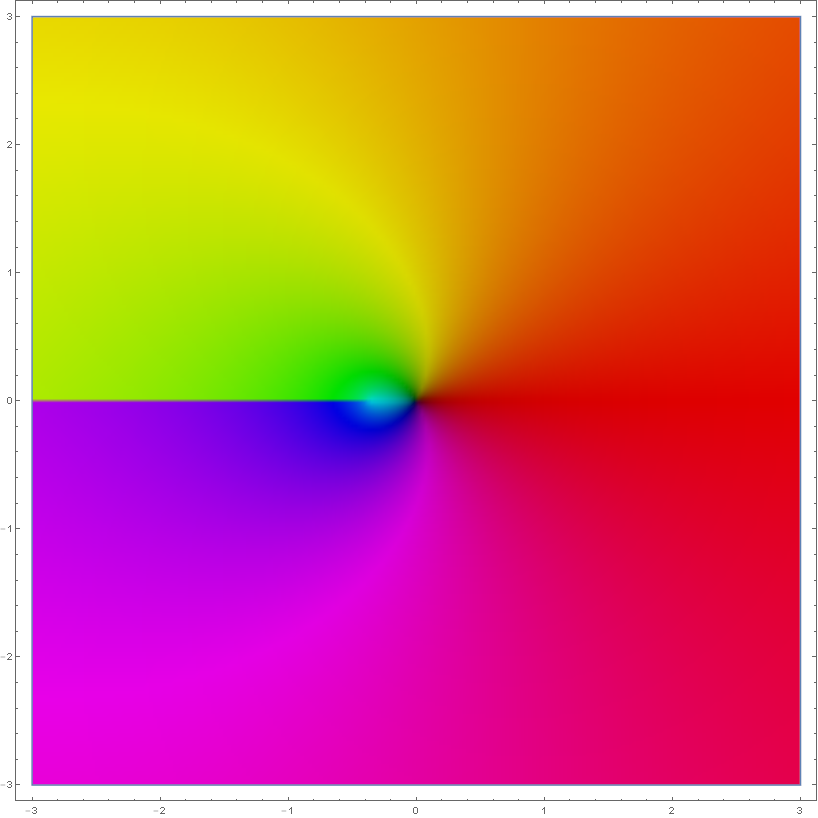 |
103 KB | Tom | ComplexGraph[ProductLog, {-3, 3}, {-3, 3}], where ComplexGraph is defined in format notes | 1 |
| 20:31, 19 February 2015 | Complexlambertw-1.png (file) | 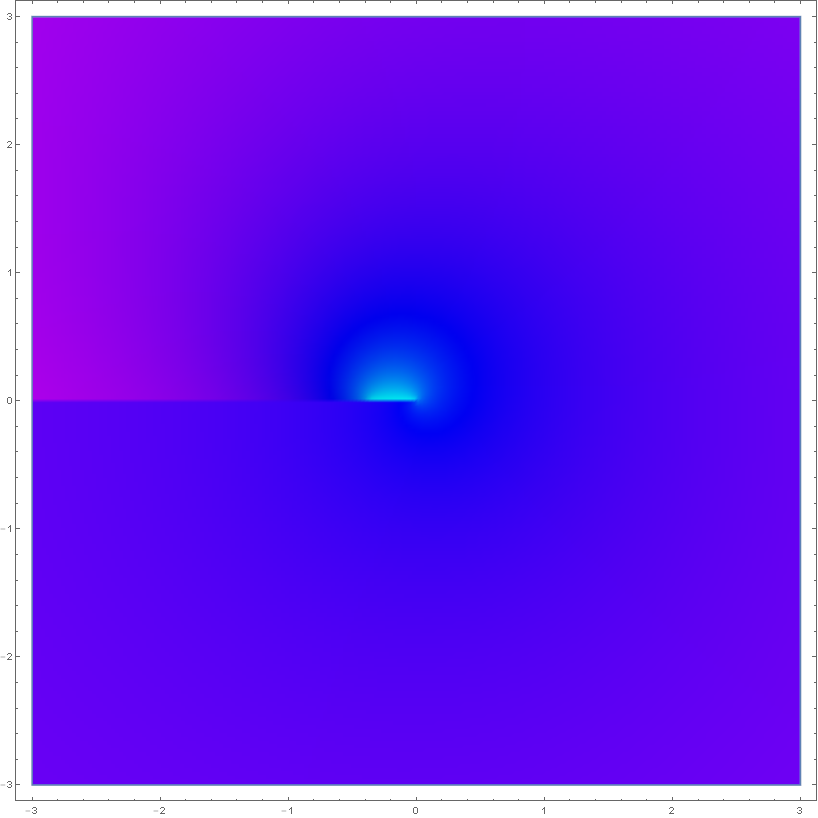 |
50 KB | Tom | foolog[z_] := ProductLog[-1, z] ComplexGraph[foolog, {-3, 3}, {-3, 3}], where ComplexGraph is defined in format notes | 1 |
| 20:38, 19 February 2015 | Complexidentity.png (file) | 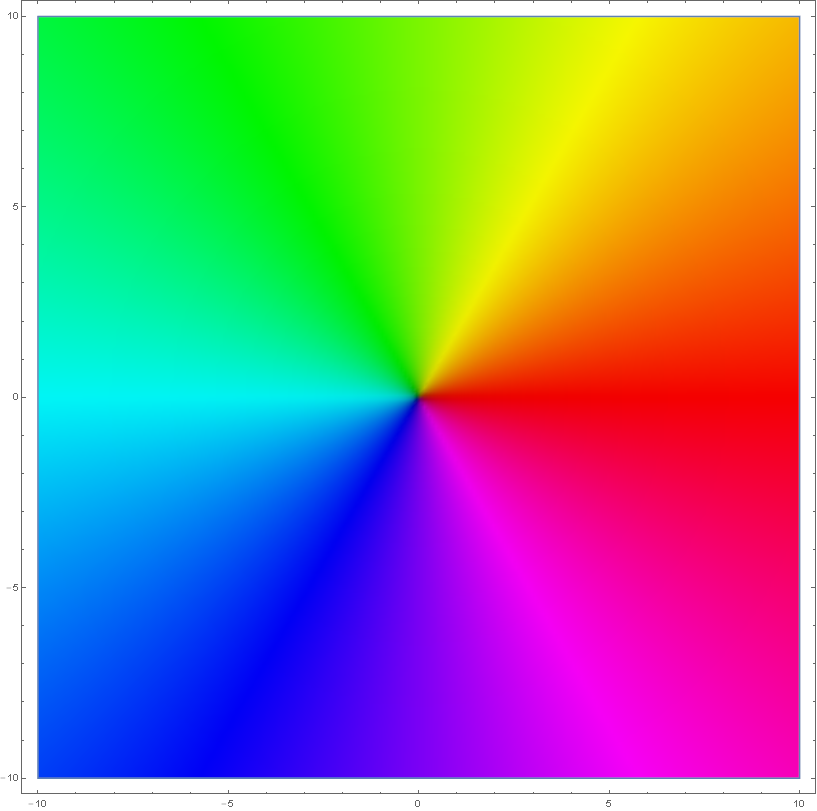 |
125 KB | Tom | ident[z_] := z ComplexGraph[ident, {-10, 10}, {-10, 10}], where ComplexGraph is defined in format notes | 1 |
| 17:15, 10 March 2015 | Fresnelsthumb.png (file) |  |
7 KB | Tom | Plot[FresnelS[x], {x, -4, 4}, PlotStyle -> {Thickness[0.04], Black}, AxesStyle -> Thickness[0.01], Ticks -> None] | 1 |
| 10:33, 23 March 2015 | Chebyshevtthumb.png (file) |  |
9 KB | Tom | Plot[{ChebyshevT[1, x], ChebyshevT[2, x], ChebyshevT[3, x]}, {x, -1, 1}, PlotStyle -> {{Thickness[0.015], Black}, {Thickness[0.015], Black}, {Thickness[0.015], Black}}, AxesStyle -> Thickness[0.01], Ticks -> None] | 1 |
| 23:01, 1 April 2015 | Ramanujantau.png (file) | 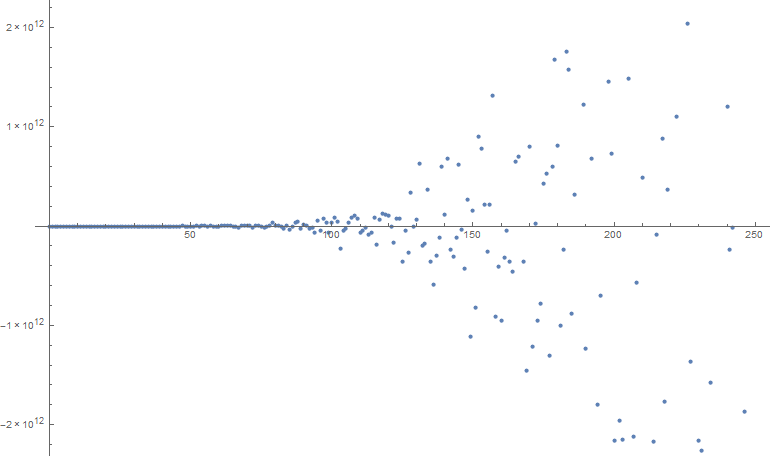 |
9 KB | Tom | DiscretePlot[RamanujanTau[n], {n, 0, 250}, Filling -> None] | 1 |
| 23:10, 1 April 2015 | Thomae.png (file) | 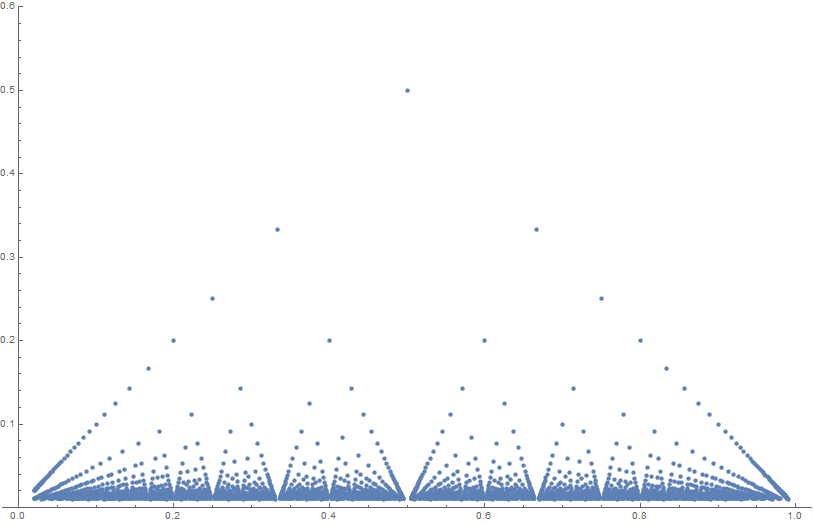 |
25 KB | Tom | see this for details on how it was plotted | 1 |
| 19:13, 17 May 2015 | Blancmangethumb.png (file) | 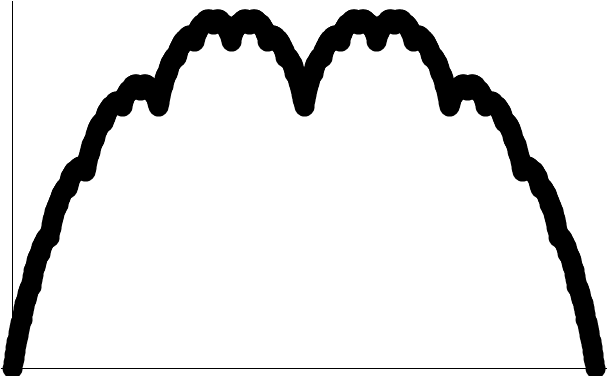 |
14 KB | Tom | b@n_ := FoldList[# + {1, #2}/2^n &, {0, 0}, Total /@ (2 Reverse[ IntegerDigits[#, 2, n] & /@ Range[0, 2^n - 1]] - 1)] ListPlot[b[10], PlotStyle -> {Automatic, AbsolutePointSize[20], Black}, AxesStyle -> Thickness[0.001], Ticks -> None] | 1 |
| 05:37, 18 May 2015 | Complex tanc.png (file) | 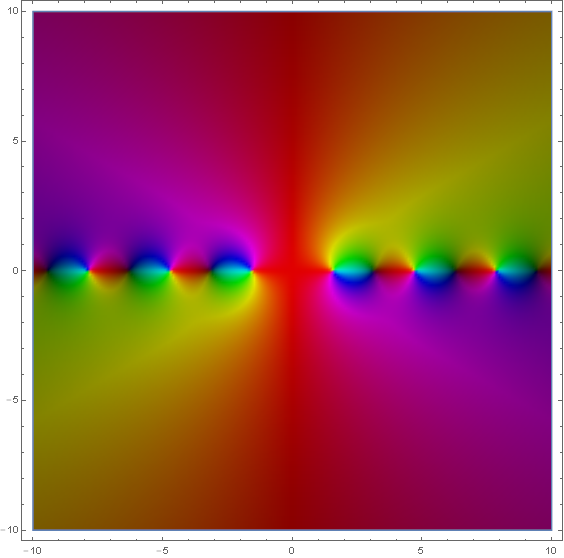 |
106 KB | Tom | g[z_] := Tan[z]/z ComplexGraph[g, {-10, 10}, {-10, 10}] | 1 |
| 05:44, 18 May 2015 | Tancthumb.png (file) | 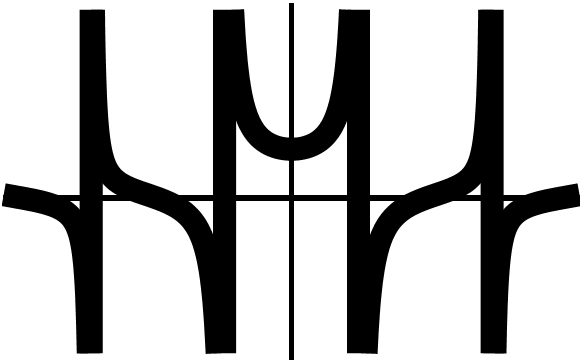 |
9 KB | Tom | g[z_] := Tan[z]/z Plot[g[x], {x, -6.5, 6.5}, PlotStyle -> {Thickness[0.04], Black}, AxesStyle -> Thickness[0.01], Ticks -> None] | 1 |
| 05:48, 18 May 2015 | Sincthumb.png (file) | 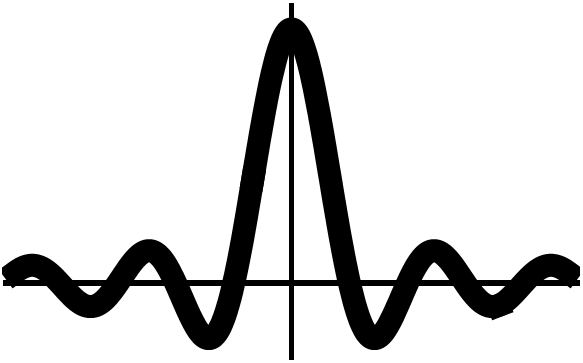 |
11 KB | Tom | Plot[Sinc[x], {x, -15, 15}, PlotStyle -> {Thickness[0.04], Black}, AxesStyle -> Thickness[0.01], Ticks -> None, PlotRange -> {-0.3, 1.1}] | 1 |
| 06:08, 18 May 2015 | Complex sinhc.png (file) | 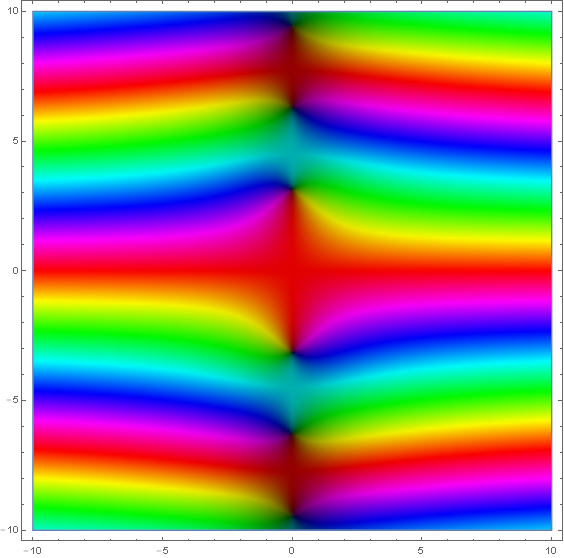 |
96 KB | Tom | g[z_] := Sinh[z]/z ComplexGraph[g, {-10, 10}, {-10, 10}] | 1 |
First page |
Previous page |
Next page |
Last page |