File list
This special page shows all uploaded files.
First page |
Previous page |
Next page |
Last page |
| Date | Name | Thumbnail | Size | User | Description | Versions |
|---|---|---|---|---|---|---|
| 21:43, 16 August 2015 | Mobiusmuplot,n=0..500.png (file) | 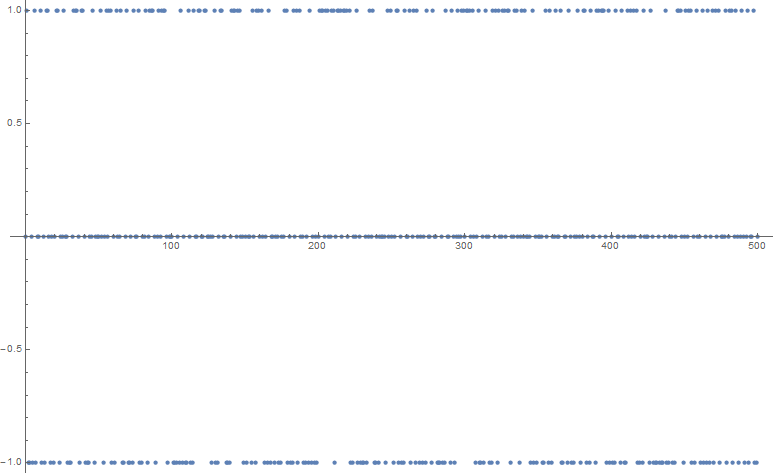 |
8 KB | Tom | DiscretePlot[MoebiusMu[n], {n, 0, 500}, Filling -> None] | 1 |
| 21:53, 16 August 2015 | Gpfthumb.png (file) |  |
2 KB | Tom | 1 | |
| 22:15, 16 August 2015 | Expintegralethumb.png (file) | 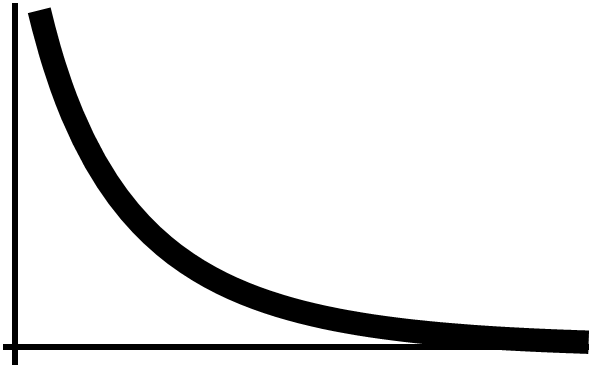 |
7 KB | Tom | Plot[ExpIntegralE[2, x], {x, 0, 3}, PlotStyle -> {Thickness[0.04], Black}, AxesStyle -> Thickness[0.01], Ticks -> None] | 1 |
| 14:25, 19 August 2015 | Domcollogarithm.png (file) | 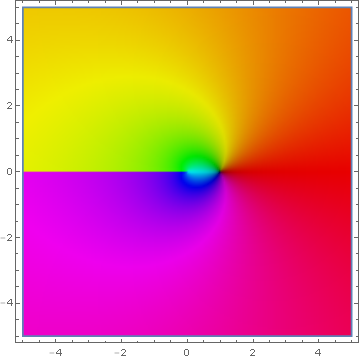 |
33 KB | Tom | ComplexGraph[Log, {-5, 5}, {-5, 5}] | 1 |
| 14:26, 19 August 2015 | Plotlogarithm.png (file) | 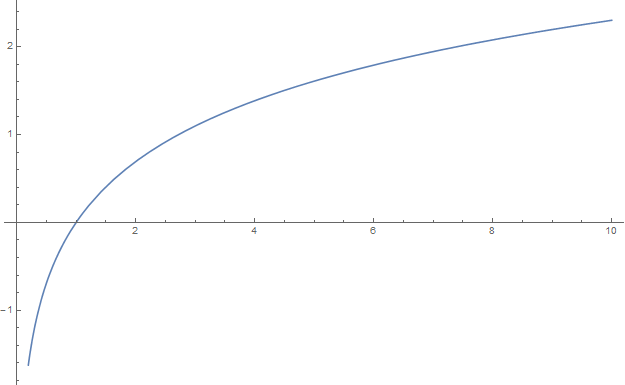 |
8 KB | Tom | Plot[Log[t], {t, 0, 10}] | 1 |
| 01:59, 21 August 2015 | Domcoljacobisn.png (file) | 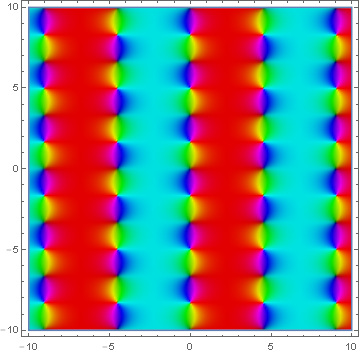 |
88 KB | Tom | test[z_] := JacobiSN[z, 0.8] ComplexGraph[test, {-10, 10}, {-10, 10}] | 1 |
| 02:03, 21 August 2015 | Domcoljacobicn.png (file) | 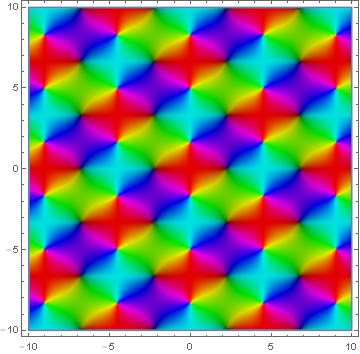 |
105 KB | Tom | test[z_] := JacobiCN[z, 0.8] ComplexGraph[test, {-10, 10}, {-10, 10}] | 1 |
| 02:05, 21 August 2015 | Domcoljacobicd.png (file) | 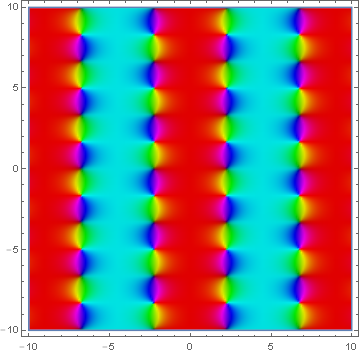 |
81 KB | Tom | test[z_] := JacobiCD[z, 0.8] ComplexGraph[test, {-10, 10}, {-10, 10}] | 1 |
| 02:12, 21 August 2015 | Domcoljacobics.png (file) | 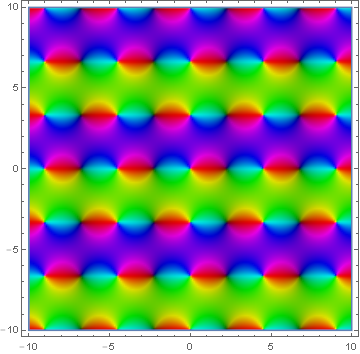 |
92 KB | Tom | test[z_] := JacobiCS[z, 0.8] ComplexGraph[test, {-10, 10}, {-10, 10}] | 1 |
| 02:15, 21 August 2015 | Domcoljacobidc.png (file) | 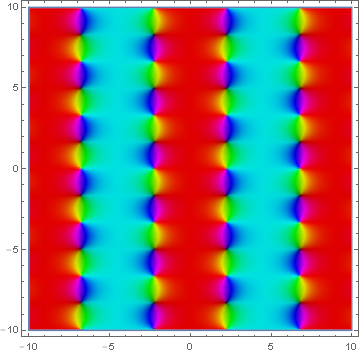 |
81 KB | Tom | test[z_] := JacobiDC[z, 0.8] ComplexGraph[test, {-10, 10}, {-10, 10}] | 1 |
| 02:29, 21 August 2015 | Domcoljacobidn.png (file) | 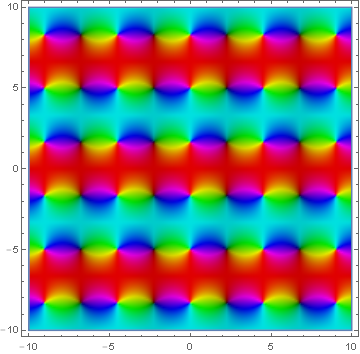 |
90 KB | Tom | test[z_] := JacobiDN[z, 0.8] ComplexGraph[test, {-10, 10}, {-10, 10}] | 1 |
| 02:34, 21 August 2015 | Domcoljacobids.png (file) | 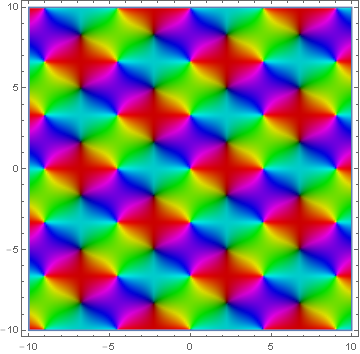 |
106 KB | Tom | test[z_] := JacobiDS[z, 0.8] ComplexGraph[test, {-10, 10}, {-10, 10}] | 1 |
| 02:37, 21 August 2015 | Domcoljacobinc.png (file) | 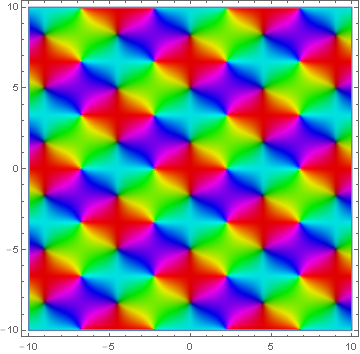 |
103 KB | Tom | test[z_] := JacobiNC[z, 0.8] ComplexGraph[test, {-10, 10}, {-10, 10}] | 1 |
| 02:39, 21 August 2015 | Domcoljacobind.png (file) | 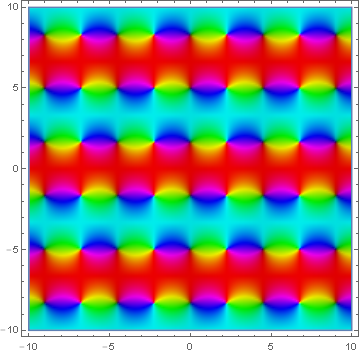 |
86 KB | Tom | test[z_] := JacobiND[z, 0.8] ComplexGraph[test, {-10, 10}, {-10, 10}] | 1 |
| 02:41, 21 August 2015 | Domcoljacobins.png (file) | 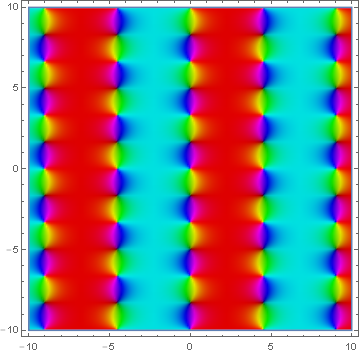 |
88 KB | Tom | test[z_] := JacobiNS[z, 0.8] ComplexGraph[test, {-10, 10}, {-10, 10}] | 1 |
| 02:46, 21 August 2015 | Domcoljacobisc.png (file) | 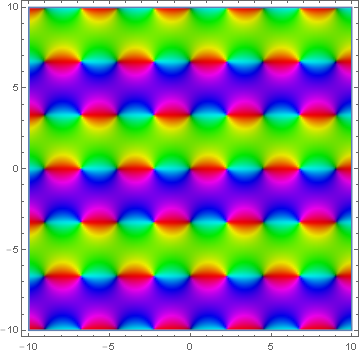 |
88 KB | Tom | test[z_] := JacobiSC[z, 0.8] ComplexGraph[test, {-10, 10}, {-10, 10}] | 1 |
| 02:48, 21 August 2015 | Domcoljacobisd.png (file) | 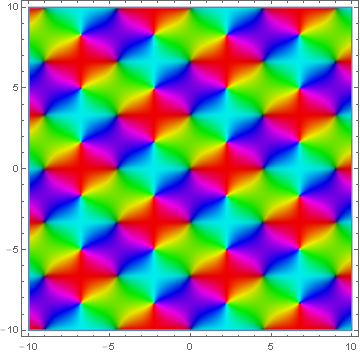 |
103 KB | Tom | test[z_] := JacobiSD[z, 0.8] ComplexGraph[test, {-10, 10}, {-10, 10}] | 1 |
| 02:52, 21 August 2015 | Domcolbesselysub1.png (file) | 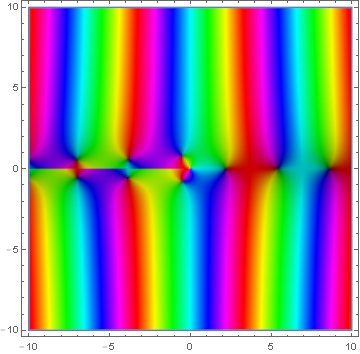 |
48 KB | Tom | test[z_] := BesselY[1, z] ComplexGraph[test, {-10, 10}, {-10, 10}] | 1 |
| 02:57, 21 August 2015 | Domcolsphericalbesseljsub0.png (file) | 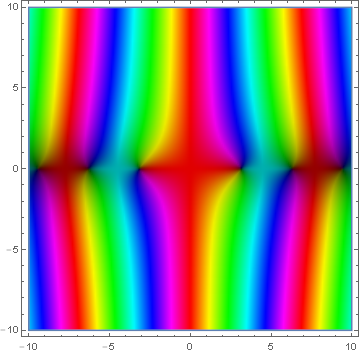 |
51 KB | Tom | test[z_] := SphericalBesselJ[0, z] ComplexGraph[test, {-10, 10}, {-10, 10}] | 1 |
| 02:59, 21 August 2015 | Domcolsphericalbesselysub0.png (file) | 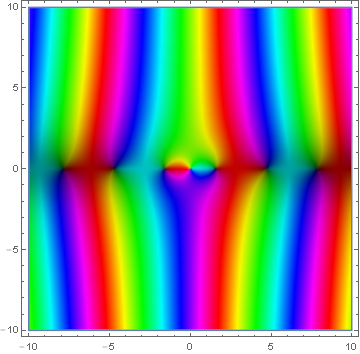 |
52 KB | Tom | test[z_] := SphericalBesselY[0, z] ComplexGraph[test, {-10, 10}, {-10, 10}] | 1 |
| 03:11, 21 August 2015 | Domcolkelvinbersub0.png (file) | 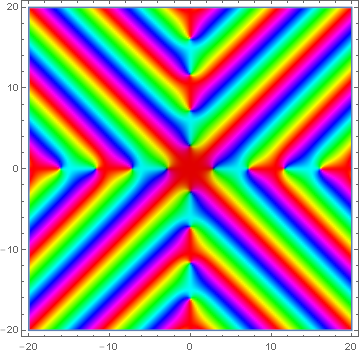 |
86 KB | Tom | test[z_] := KelvinBer[0, z] ComplexGraph[test, {-20, 20}, {-20, 20}] | 1 |
| 03:14, 21 August 2015 | Domcolkelvinbeisub0.png (file) | 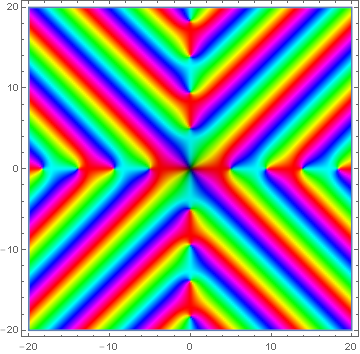 |
88 KB | Tom | test[z_] := KelvinBei[0, z] ComplexGraph[test, {-20, 20}, {-20, 20}] | 1 |
| 03:17, 21 August 2015 | Domcolkelvinkersub0.png (file) | 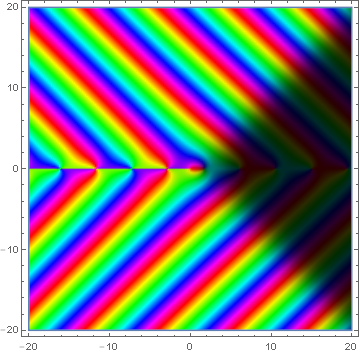 |
89 KB | Tom | test[z_] := KelvinKer[0, z] ComplexGraph[test, {-20, 20}, {-20, 20}] | 1 |
| 03:19, 21 August 2015 | Domcolkelvinkeisub0.png (file) | 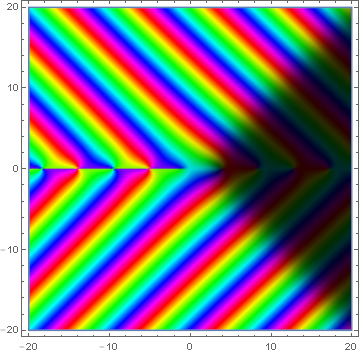 |
88 KB | Tom | test[z_] := KelvinKei[0, z] ComplexGraph[test, {-20, 20}, {-20, 20}] | 1 |
| 03:25, 21 August 2015 | Kelvinberthumb.png (file) | 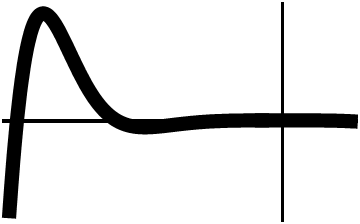 |
4 KB | Tom | Plot[KelvinBer[0, x], {x, -12, 3}, PlotStyle -> {Thickness[0.04], Black}, AxesStyle -> Thickness[0.01], Ticks -> None] | 1 |
| 03:26, 21 August 2015 | Kelvinbeithumb.png (file) | 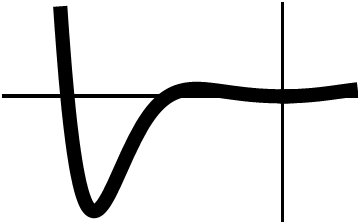 |
4 KB | Tom | Plot[KelvinBei[0, x], {x, -12, 3}, PlotStyle -> {Thickness[0.04], Black}, AxesStyle -> Thickness[0.01], Ticks -> None] | 1 |
| 03:27, 21 August 2015 | Kelvinkeithumb.png (file) | 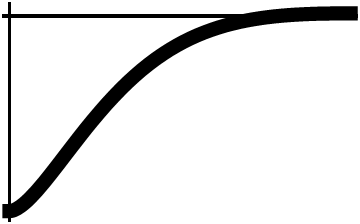 |
4 KB | Tom | Plot[KelvinKer[0, x], {x, 0, 5}, PlotStyle -> {Thickness[0.04], Black}, AxesStyle -> Thickness[0.01], Ticks -> None] | 1 |
| 03:27, 21 August 2015 | Kelvinkerthumb.png (file) |  |
4 KB | Tom | Plot[KelvinKer[0, x], {x, 0, 5}, PlotStyle -> {Thickness[0.04], Black}, AxesStyle -> Thickness[0.01], Ticks -> None] | 1 |
| 03:43, 21 August 2015 | Erfcthumb.png (file) | 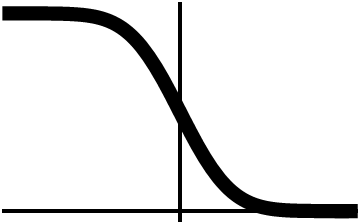 |
4 KB | Tom | Plot[Erfc[x], {x, -3, 3}, PlotStyle -> {Thickness[0.04], Black}, AxesStyle -> Thickness[0.01], Ticks -> None] | 1 |
| 03:52, 21 August 2015 | Erfithumb.png (file) | 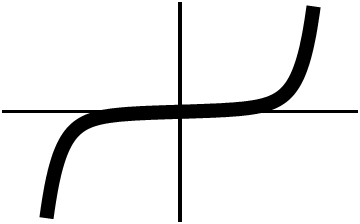 |
4 KB | Tom | Plot[Erfi[x], {x, -3, 3}, PlotStyle -> {Thickness[0.04], Black}, AxesStyle -> Thickness[0.01], Ticks -> None] | 1 |
| 03:56, 21 August 2015 | Domcolerfi.png (file) | 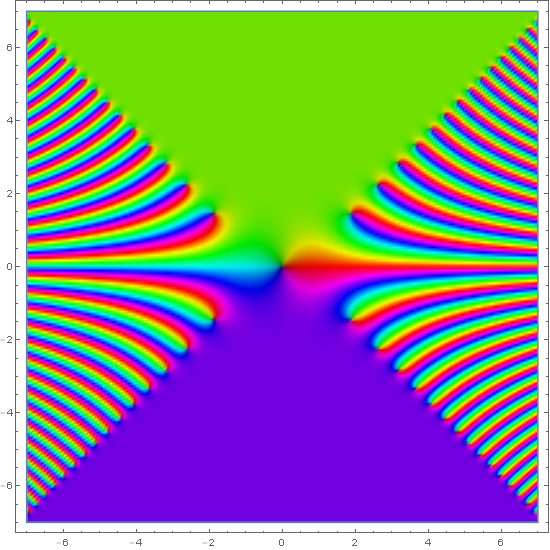 |
219 KB | Tom | ComplexGraph[Erfi, {-7, 7}, {-7, 7}] | 1 |
| 04:00, 21 August 2015 | Inverseerfthumb.png (file) | 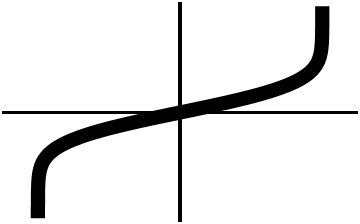 |
4 KB | Tom | Plot[InverseErf[x], {x, -1.2, 1.2}, PlotStyle -> {Thickness[0.04], Black}, AxesStyle -> Thickness[0.01], Ticks -> None] | 1 |
| 04:28, 21 August 2015 | Domcoljinc.png (file) | 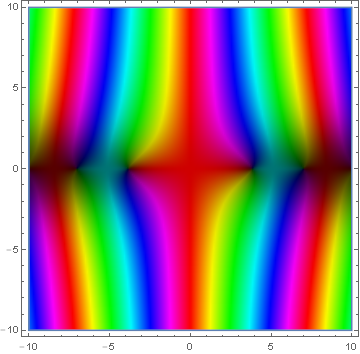 |
54 KB | Tom | Jinc[t_] := BesselJ[1, t]/t ComplexGraph[Jinc, {-10, 10}, {-10, 10}] | 1 |
| 04:32, 21 August 2015 | Jincthumb.png (file) | 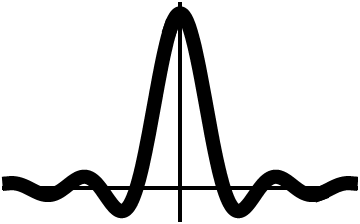 |
6 KB | Tom | Plot[Jinc[x], {x, -15, 15}, PlotStyle -> {Thickness[0.04], Black}, AxesStyle -> Thickness[0.01], Ticks -> None] | 1 |
| 22:17, 25 August 2015 | Gudermannianthumb.png (file) |  |
4 KB | Tom | Plot[Gudermannian[x], {x, -5, 5}, PlotStyle -> {Thickness[0.04], Black}, AxesStyle -> Thickness[0.01], Ticks -> None] | 1 |
| 23:07, 25 August 2015 | Gudermannianplot.png (file) | 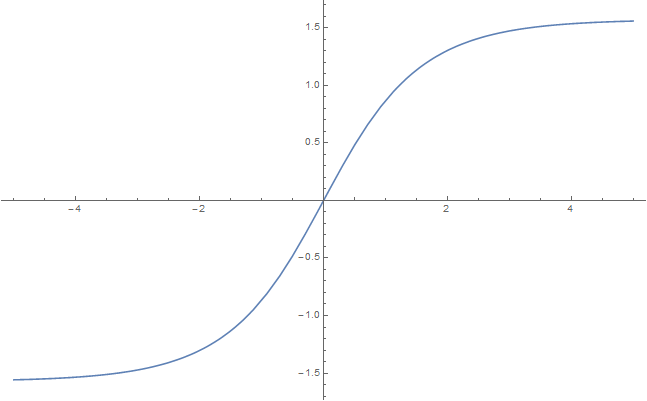 |
10 KB | Tom | Plot[Gudermannian[t], {t, -5, 5}] | 1 |
| 23:07, 25 August 2015 | Domcolgudermannian.png (file) | 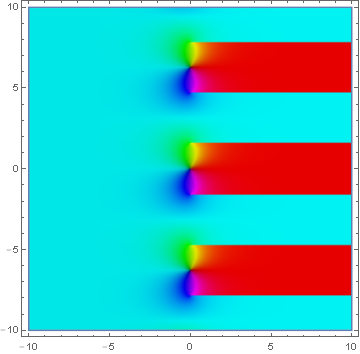 |
25 KB | Tom | ComplexGraph[Gudermannian, {-10, 10}, {-10, 10}] | 1 |
| 23:12, 25 August 2015 | Inversegudermannianthumb.png (file) | 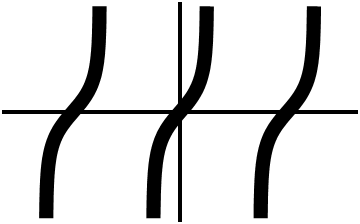 |
5 KB | Tom | Plot[InverseGudermannian[x], {x, -10, 10}, PlotStyle -> {Thickness[0.04], Black}, AxesStyle -> Thickness[0.01], Ticks -> None] | 1 |
| 23:20, 25 August 2015 | Inversegudermannianplot.png (file) | 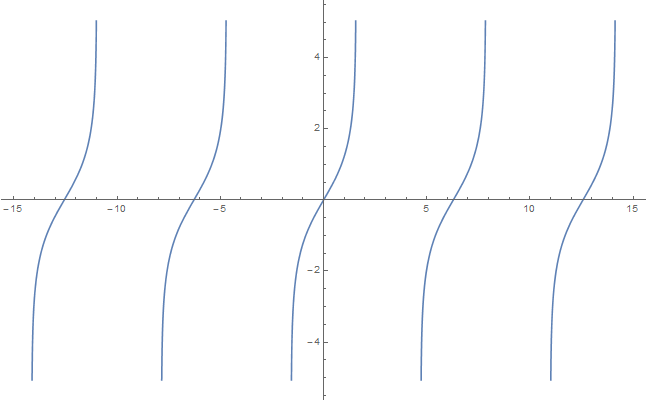 |
12 KB | Tom | Plot[InverseGudermannian[t], {t, -15, 15}] | 1 |
| 23:21, 25 August 2015 | Domcolinversegudermannian.png (file) | 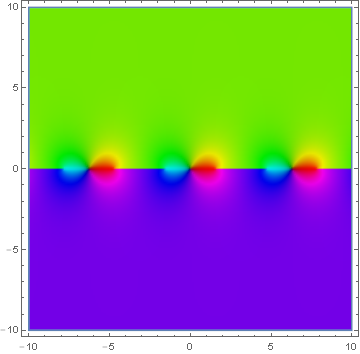 |
25 KB | Tom | ComplexGraph[Gudermannian, {-10, 10}, {-10, 10}] | 1 |
| 04:05, 4 September 2015 | Chebyshevpsiplotto1000.png (file) | 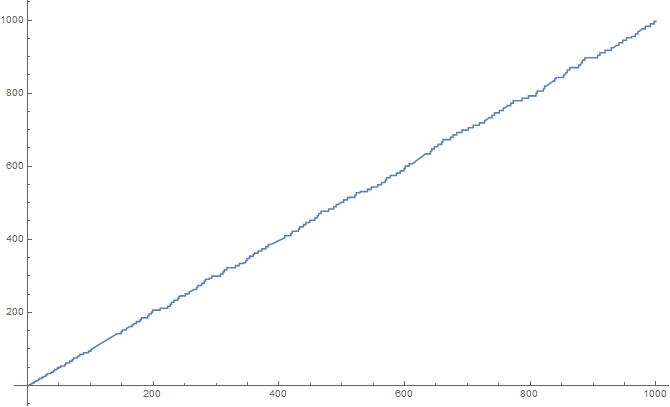 |
10 KB | Tom | ChebPsi[x_] := Sum[MangoldtLambda[k], {k, 1, Floor[x]}] Plot[ChebPsi[x], {x, 0, 20}, PlotStyle -> {Thickness[0.04], Black}, AxesStyle -> Thickness[0.01], Ticks -> None] | 2 |
| 04:06, 4 September 2015 | Chebyshevpsithumb.png (file) |  |
2 KB | Tom | 1 | |
| 04:58, 4 September 2015 | Chebyshevpsiplotto100.png (file) | 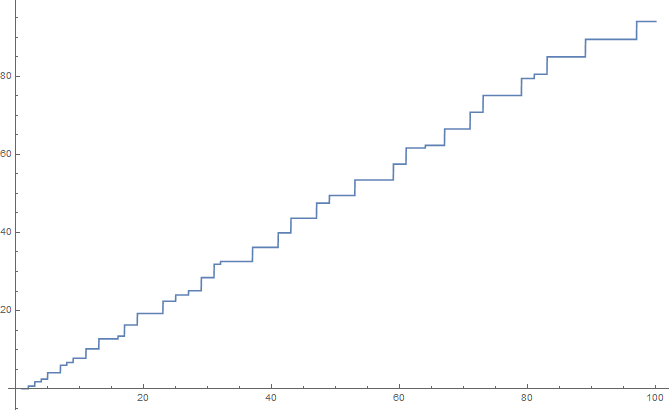 |
6 KB | Tom | Reverted to version as of 04:02, 4 September 2015 | 3 |
| 05:05, 4 September 2015 | Chebthetathumb.png (file) |  |
2 KB | Tom | ChebTheta[x_] := Sum[Log[Prime[k]], {k, 1, PrimePi[x]}] Export["chebthetathumb.png", Plot[ChebTheta[x], {x, 0, 20}, PlotStyle -> {Thickness[0.04], Black}, AxesStyle -> Thickness[0.01], Ticks -> None]] | 1 |
| 00:07, 7 September 2015 | Besselj1thumb.png (file) |  |
9 KB | Tom | Plot[BesselJ[1, x], {x, -15, 15}, PlotStyle -> {Thickness[0.04], Black}, AxesStyle -> Thickness[0.01], Ticks -> None] Category:BesselJThumb | 1 |
| 17:42, 31 December 2015 | Scorergithumb.png (file) |  |
16 KB | Tom | Plot[ScorerGi[x], {x, -3, 3}, PlotStyle -> {Thickness[0.04], Black}, AxesStyle -> Thickness[0.01], Ticks -> None] | 1 |
| 17:43, 31 December 2015 | Scorerhithumb.png (file) | 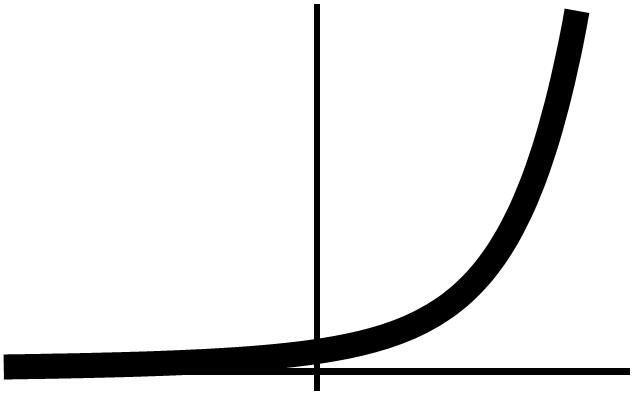 |
7 KB | Tom | Plot[ScorerHi[x], {x, -3, 3}, PlotStyle -> {Thickness[0.04], Black}, AxesStyle -> Thickness[0.01], Ticks -> None] | 1 |
| 13:19, 5 January 2016 | Riemannfunction.gif (file) | 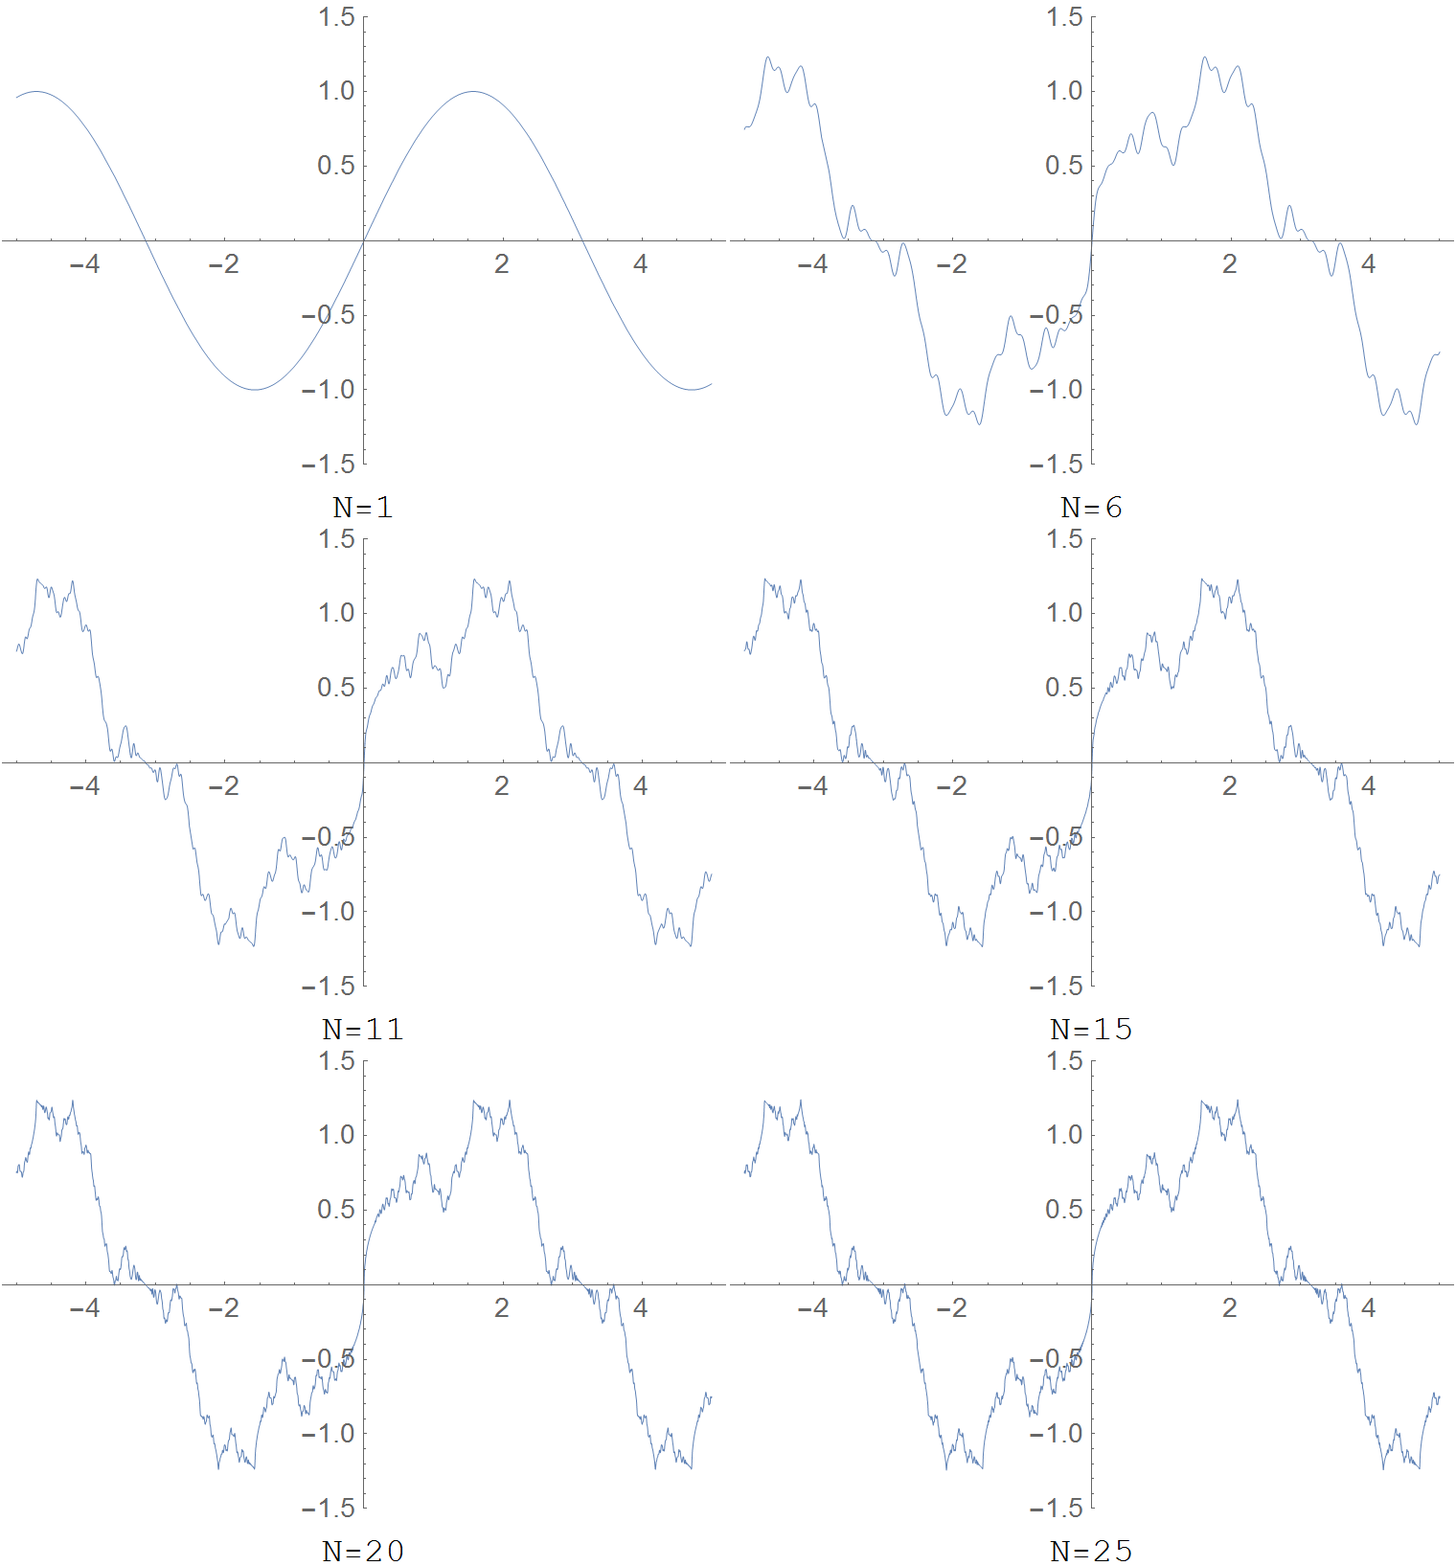 |
285 KB | Tom | R[x_, N_] := Sum[Sin[k^2*x]/k^2, {k, 1, N}] plotme = Table[ Plot[R[x, N], {x, -5, 5}, PlotLegends -> Placed[StringJoin["N=", ToString[N]], Bottom], PlotRange -> {-1.5, 1.5}, PlotStyle -> Thickness[0.001]], {N, 1, 25, 1}]; Export["ri... | 1 |
| 17:55, 29 January 2016 | Sineglyph.png (file) |  |
6 KB | Tom | <pre> #!/usr/bin/python import numpy as np import matplotlib.pyplot as plt from mpmath import * from pylab import rcParams rcParams['figure.figsize'] = 2.4,2.4 x=np.arange(0,2*pi,0.00001) f=np.vectorize(sin) y=f(x) fig, ax = plt.subplots() plt.ylim([... | 1 |
| 17:57, 29 January 2016 | Cosineglyph.png (file) |  |
6 KB | Tom | <pre> #!/usr/bin/python import numpy as np import matplotlib.pyplot as plt from mpmath import * from pylab import rcParams rcParams['figure.figsize'] = 2.4,2.4 x=np.arange(0,2*pi,0.00001) f=np.vectorize(cos) y=f(x) fig, ax = plt.subplots() plt.ylim([... | 1 |
First page |
Previous page |
Next page |
Last page |