File list
This special page shows all uploaded files.
First page |
Previous page |
Next page |
Last page |
| Date | Name | Thumbnail | Size | User | Description | Versions |
|---|---|---|---|---|---|---|
| 17:59, 29 January 2016 | Tangentglyph.png (file) |  |
4 KB | Tom | <pre> #!/usr/bin/python import numpy as np import matplotlib.pyplot as plt from mpmath import * from pylab import rcParams rcParams['figure.figsize'] = 2.4,2.4 x=np.arange(0,2*pi,0.00001) f=np.vectorize(tan) y=f(x) fig, ax = plt.subplots() plt.ylim([... | 1 |
| 18:06, 29 January 2016 | Cosecantglyph.png (file) |  |
5 KB | Tom | <pre> #!/usr/bin/python import numpy as np import matplotlib.pyplot as plt from mpmath import * from pylab import rcParams rcParams['figure.figsize'] = 2.4,2.4 x=np.arange(0.0000001,2*pi,0.00001) f=np.vectorize(csc) y=f(x) fig, ax = plt.subplots() pl... | 1 |
| 18:09, 29 January 2016 | Secantglyph.png (file) |  |
5 KB | Tom | <pre> #!/usr/bin/python import numpy as np import matplotlib.pyplot as plt from mpmath import * from pylab import rcParams rcParams['figure.figsize'] = 2.4,2.4 x=np.arange(0.0000001,2*pi,0.00001) f=np.vectorize(sec) y=f(x) fig, ax = plt.subplots() pl... | 1 |
| 18:11, 29 January 2016 | Cotangentglyph.png (file) |  |
5 KB | Tom | <pre> #!/usr/bin/python import numpy as np import matplotlib.pyplot as plt from mpmath import * from pylab import rcParams rcParams['figure.figsize'] = 2.4,2.4 x=np.arange(0.0000001,2*pi,0.00001) f=np.vectorize(cot) y=f(x) fig, ax = plt.subplots() pl... | 1 |
| 19:57, 7 February 2016 | Complexsineglyph.png (file) |  |
148 KB | Tom | 1 | |
| 20:17, 7 February 2016 | Complexcosineglyph.png (file) |  |
149 KB | Tom | Category:Cosineglyph | 1 |
| 20:21, 7 February 2016 | Complextangentglyph.png (file) |  |
148 KB | Tom | Category:Tangentglyph | 1 |
| 20:25, 7 February 2016 | Complexsecantglyph.png (file) |  |
148 KB | Tom | Category:Secantglyph | 1 |
| 20:30, 7 February 2016 | Complexcosecantglyph.png (file) |  |
148 KB | Tom | Category:Cosecantglyph | 1 |
| 21:00, 7 February 2016 | Complexcotangentglyph.png (file) |  |
148 KB | Tom | Category:Cotangentglyph | 1 |
| 02:00, 8 February 2016 | Sineplot.png (file) | 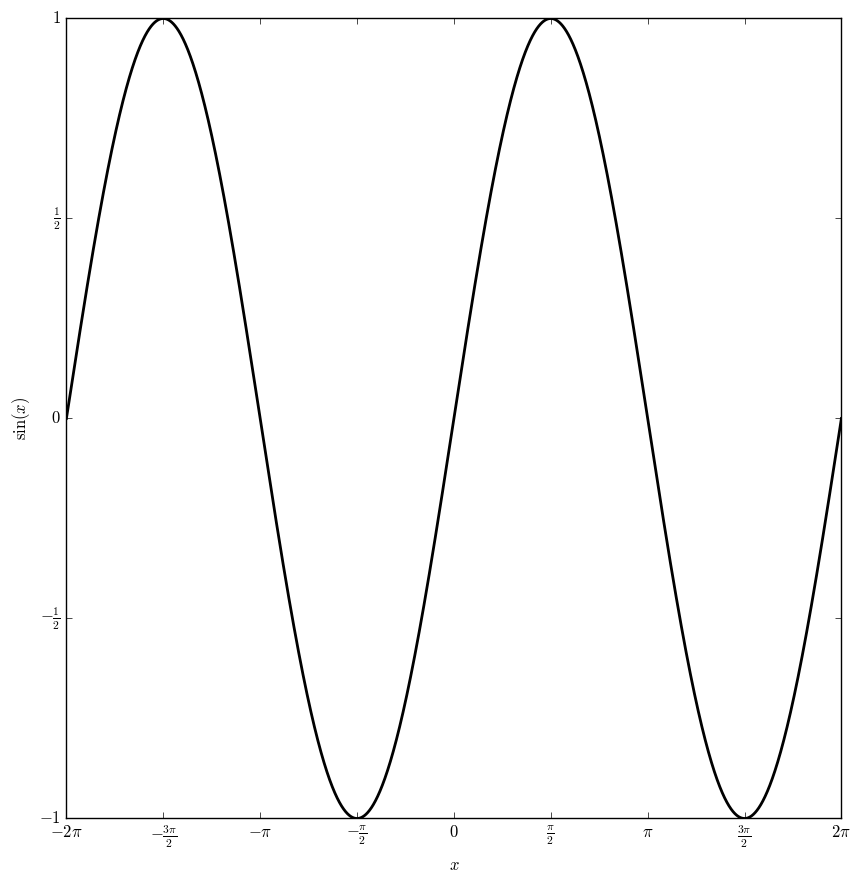 |
41 KB | Tom | <pre>#!/usr/bin/python import numpy as np import matplotlib.pyplot as plt from mpmath import * from pylab import rcParams rcParams['figure.figsize'] = 10, 10 x=np.arange(-2*pi,2*pi,0.00001); f=np.vectorize(sin) y=f(x) fig, ax = plt.subplots() xlabel... | 1 |
| 02:34, 8 February 2016 | Cosineplot.png (file) | 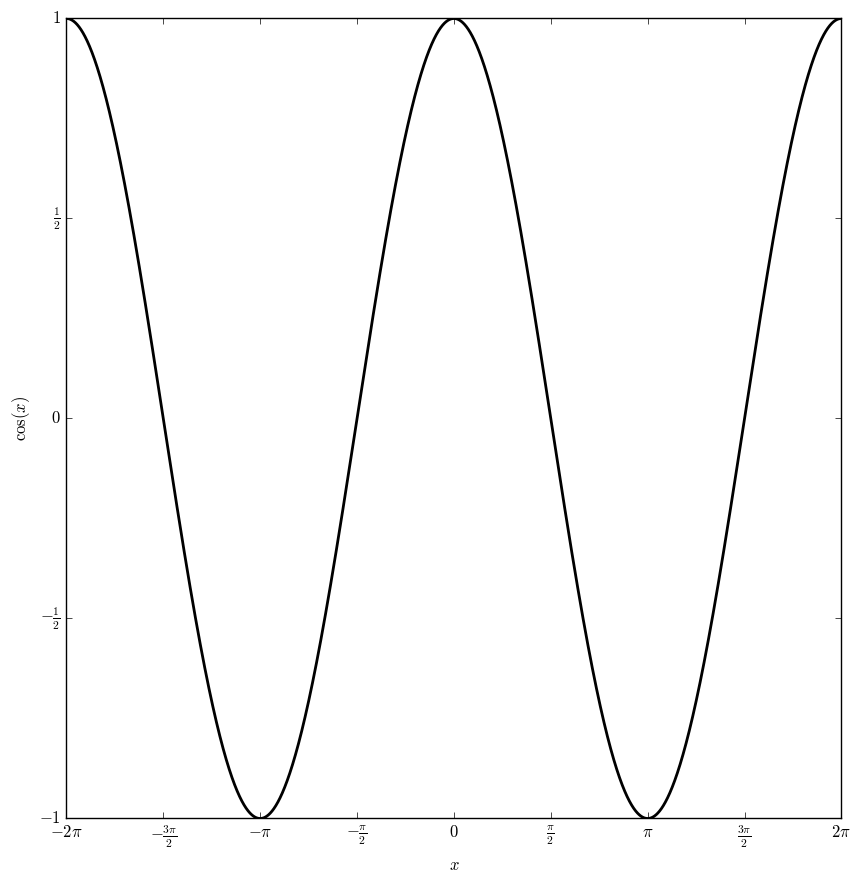 |
41 KB | Tom | <pre>#!/usr/bin/python import numpy as np import matplotlib.pyplot as plt from mpmath import * from pylab import rcParams rcParams['figure.figsize'] = 10, 10 x=np.arange(-2*pi,2*pi,0.00001); f=np.vectorize(cos) y=f(x) fig, ax = plt.subplots() xlabe... | 1 |
| 02:44, 8 February 2016 | Complexsineplot.png (file) | 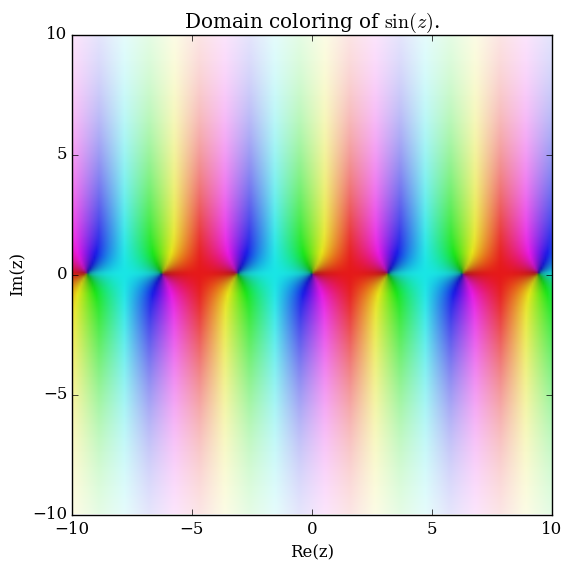 |
100 KB | Tom | <pre>#!/usr/bin/python import numpy as np import matplotlib.pyplot as plt from mpmath import * cplot(sin,[-10,10],[-10,10],points=50000,verbose=True) plt.title('Domain coloring of $\sin(z)$.') plt.savefig('complexsineplot.png',bbox_inches='tight',pad_... | 1 |
| 03:00, 8 February 2016 | Complexcosineplot.png (file) | 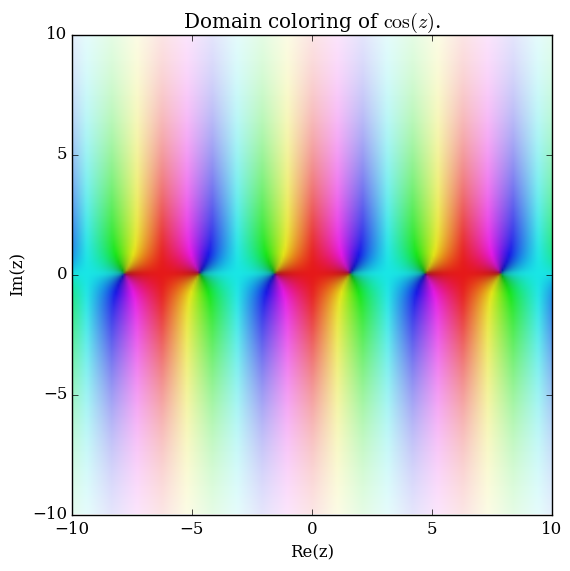 |
100 KB | Tom | Category:DomainColoring <pre>#!/usr/bin/python import numpy as np import matplotlib.pyplot as plt from mpmath import * cplot(cos,[-10,10],[-10,10],points=50000,verbose=True) plt.title('Domain coloring of $\cos(z)$.') plt.savefig('complexcosineplot... | 1 |
| 03:08, 8 February 2016 | Complextangentplot.png (file) | 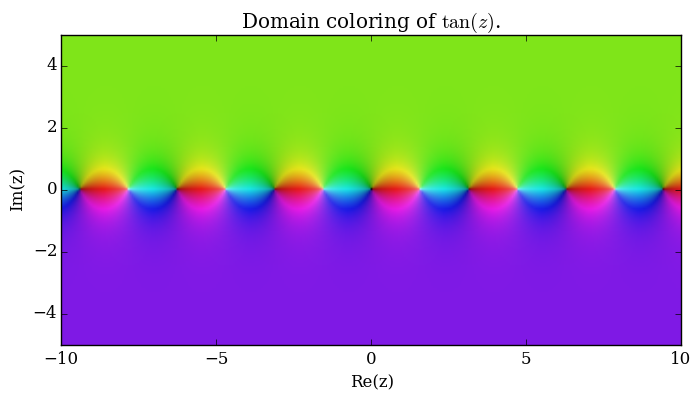 |
69 KB | Tom | Category:DomainColoring <pre>#!/usr/bin/python import numpy as np import matplotlib.pyplot as plt from mpmath import * cplot(tan,[-10,10],[-5,5],points=50000,verbose=True) plt.title(r'Domain coloring of $\tan(z)$.') plt.savefig('complextangentplot... | 1 |
| 03:16, 8 February 2016 | Tangentplot.png (file) | 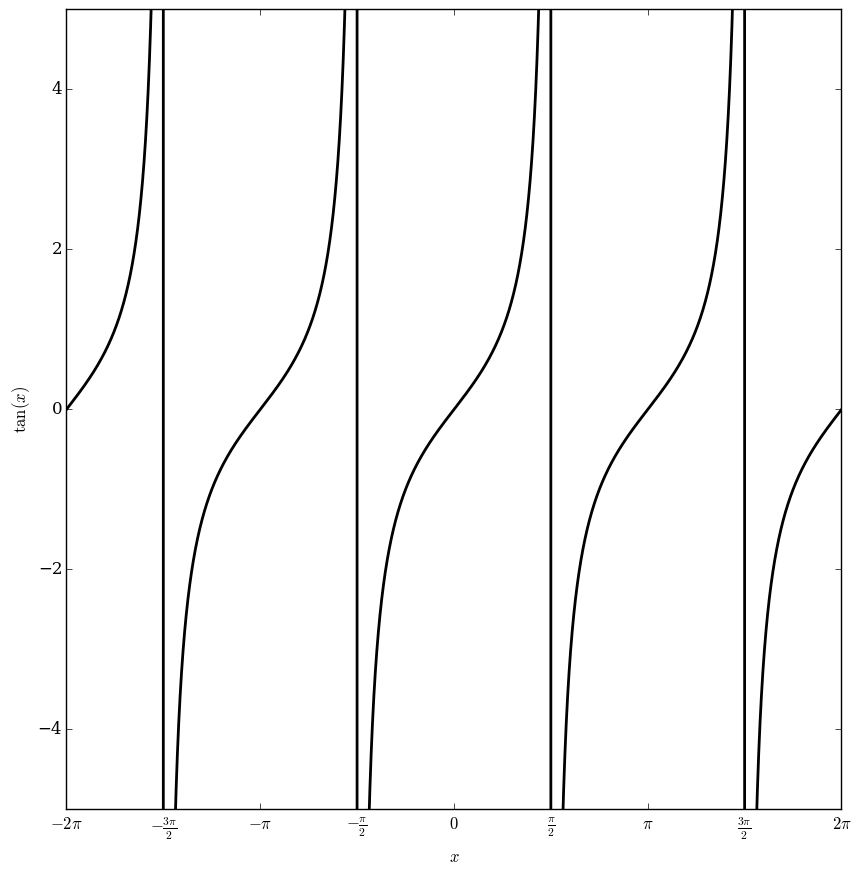 |
37 KB | Tom | Category:Plot <pre>#!/usr/bin/python import numpy as np import matplotlib.pyplot as plt from mpmath import * from pylab import rcParams rcParams['figure.figsize'] = 10, 10 x=np.arange(-2*pi+0.0001,2*pi-0.001,0.00001); f=np.vectorize(tan) y=f(x) f... | 1 |
| 04:18, 8 February 2016 | Cosecantplot.png (file) | 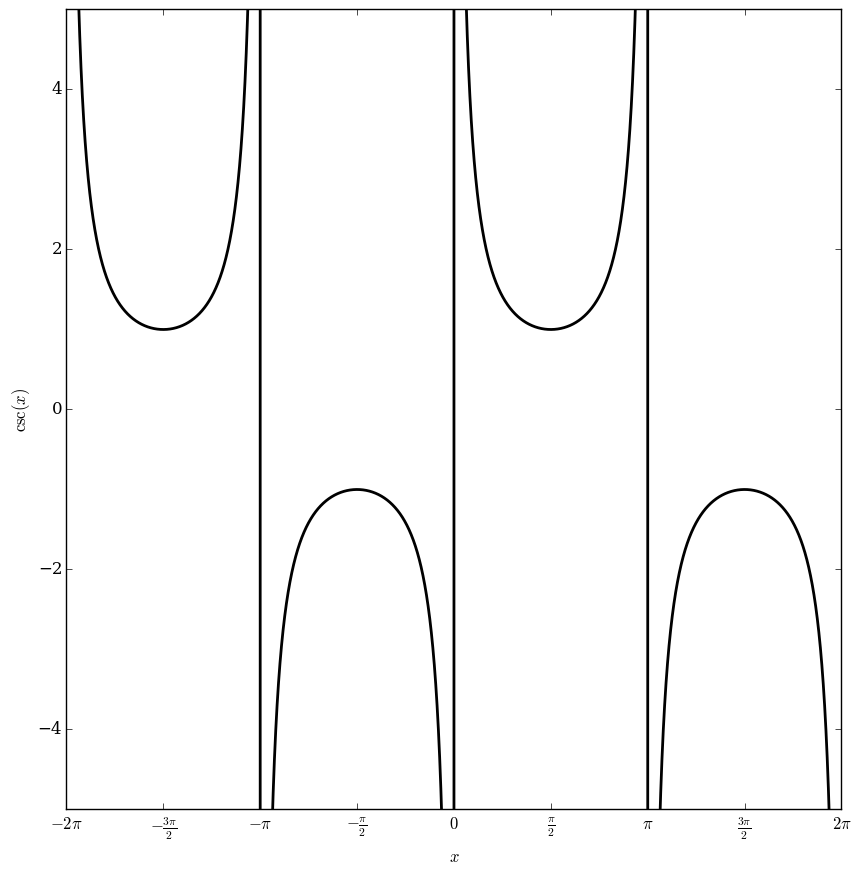 |
35 KB | Tom | Category:Plot <pre>#!/usr/bin/python import numpy as np import matplotlib.pyplot as plt from mpmath import * from pylab import rcParams rcParams['figure.figsize'] = 10, 10 x=np.arange(-2*pi+0.0001,2*pi-0.001,0.00001); f=np.vectorize(csc) y=f(x) f... | 1 |
| 04:23, 8 February 2016 | Complexcosecantplot.png (file) | 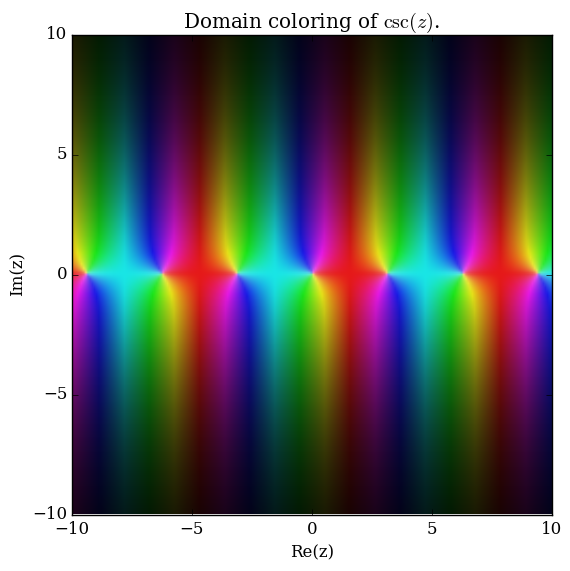 |
99 KB | Tom | Category:DomainColoring <pre> #!/usr/bin/python import numpy as np import matplotlib.pyplot as plt from mpmath import * cplot(csc,[-10,10],[-10,10],points=50000,verbose=True) plt.title(r'Domain coloring of $\csc(z)$.') plt.savefig('complexcosecant... | 1 |
| 04:33, 8 February 2016 | Complexsecantplot.png (file) | 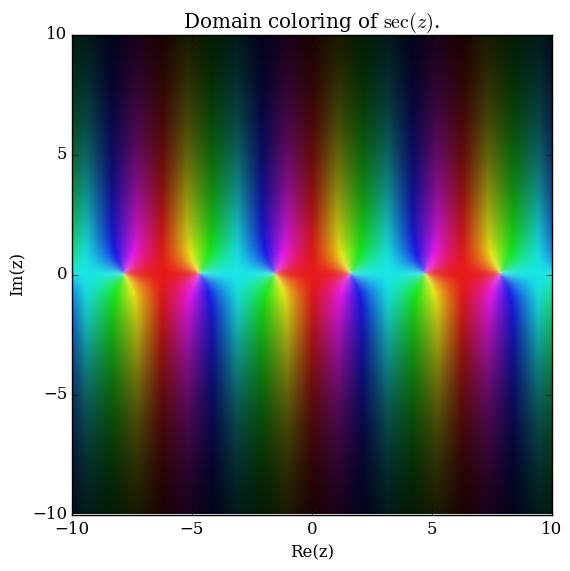 |
99 KB | Tom | Category:DomainColoring <pre>#!/usr/bin/python import numpy as np import matplotlib.pyplot as plt from mpmath import * cplot(sec,[-10,10],[-10,10],points=50000,verbose=True) plt.title(r'Domain coloring of $\sec(z)$.') plt.savefig('complexsecantplo... | 1 |
| 04:55, 8 February 2016 | Secantplot.png (file) | 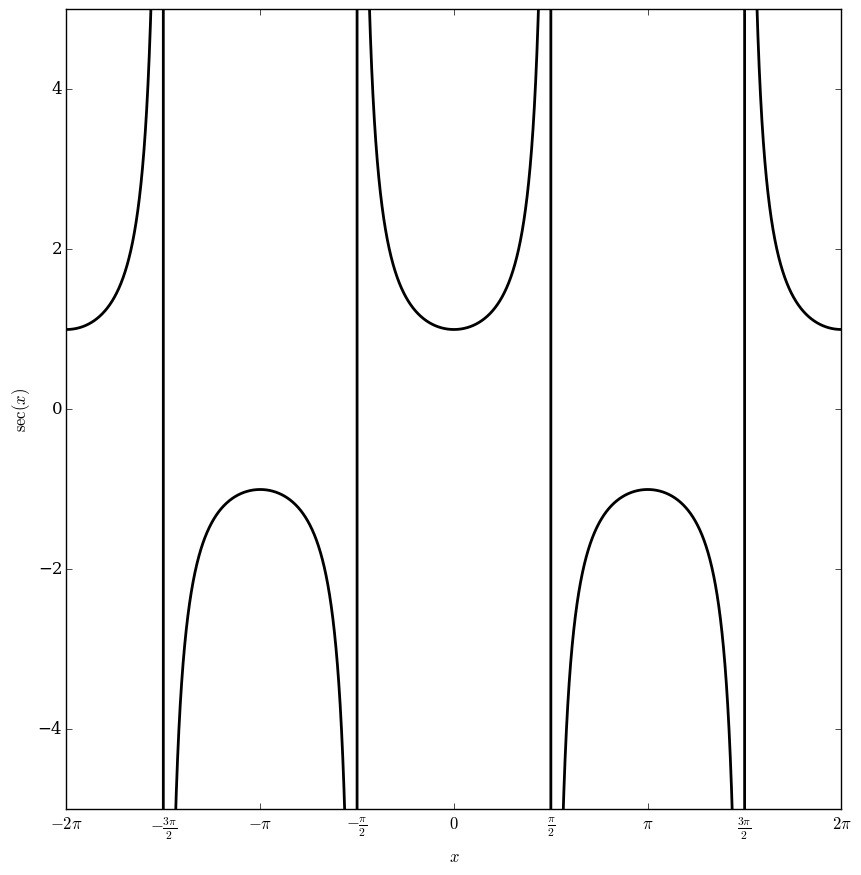 |
36 KB | Tom | Category:Plot <pre>#!/usr/bin/python import numpy as np import matplotlib.pyplot as plt from mpmath import * from pylab import rcParams rcParams['figure.figsize'] = 10, 10 x=np.arange(-2*pi+0.0001,2*pi-0.001,0.00001); f=np.vectorize(sec) y=f(x) f... | 1 |
| 05:01, 8 February 2016 | Complexcotangentplot.png (file) | 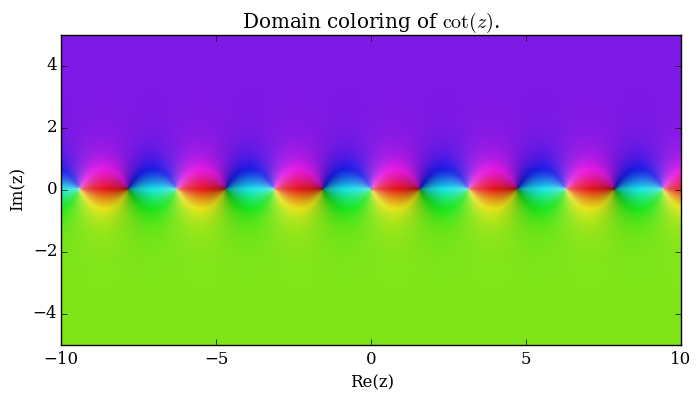 |
69 KB | Tom | Category:DomainColorings <pre>#!/usr/bin/python import numpy as np import matplotlib.pyplot as plt from mpmath import * cplot(cot,[-10,10],[-5,5],points=50000,verbose=True) plt.title(r'Domain coloring of $\cot(z)$.') plt.savefig('complexcotangentp... | 1 |
| 05:08, 8 February 2016 | Cotangentplot.png (file) | 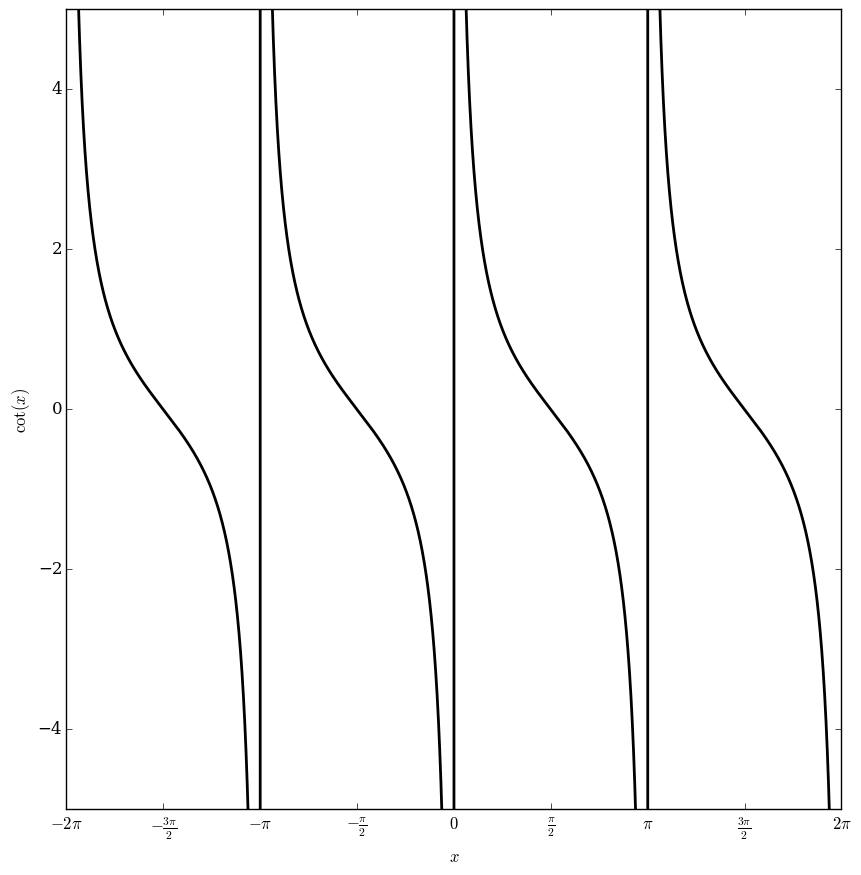 |
38 KB | Tom | Category:Plot <pre>#!/usr/bin/python import numpy as np import matplotlib.pyplot as plt from mpmath import * from pylab import rcParams rcParams['figure.figsize'] = 10, 10 x=np.arange(-2*pi+0.0001,2*pi-0.001,0.00001); f=np.vectorize(cot) y=f(x) f... | 2 |
| 05:26, 8 February 2016 | Exponentialplot.png (file) | 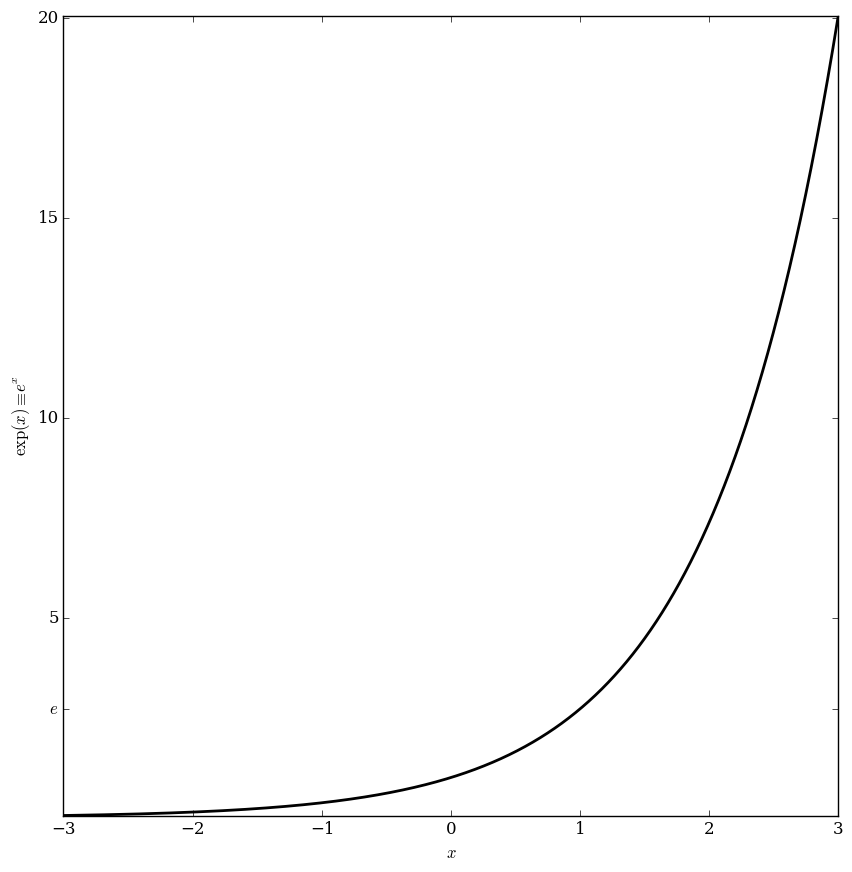 |
25 KB | Tom | Category:Plot <pre>#!/usr/bin/python import numpy as np import matplotlib.pyplot as plt from mpmath import * from pylab import rcParams rcParams['figure.figsize'] = 10, 10 x=np.arange(-3,3,0.001); f=np.vectorize(exp) y=f(x) fig, ax = plt.subplots... | 1 |
| 05:30, 8 February 2016 | Complexexponentialplot.png (file) | 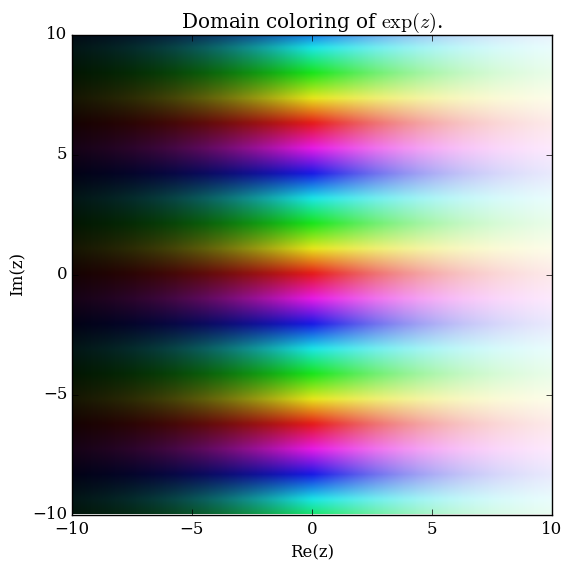 |
71 KB | Tom | Category:DomainColoring <pre>#!/usr/bin/python import numpy as np import matplotlib.pyplot as plt from mpmath import * cplot(exp,[-10,10],[-10,10],points=50000,verbose=True) plt.title('Domain coloring of $\exp(z)$.') plt.savefig('complexexponentia... | 1 |
| 02:14, 26 February 2016 | Arcsineglyph.png (file) |  |
5 KB | Tom | Category:Arcsineglyph <pre>#!/usr/bin/python import numpy as np import matplotlib.pyplot as plt from mpmath import * from pylab import rcParams rcParams['figure.figsize'] = 2.4,2.4 x=np.arange(-1,1,0.00001) f=np.vectorize(asin) y=f(x) fig, ax = p... | 1 |
| 02:29, 26 February 2016 | Arccosineglyph.png (file) |  |
5 KB | Tom | Category:Arccosineglyph <pre>#!/usr/bin/python import numpy as np import matplotlib.pyplot as plt from mpmath import * from pylab import rcParams rcParams['figure.figsize'] = 2.4,2.4 x=np.arange(-1,1,0.001) f=np.vectorize(acos) y=f(x) fig, ax = p... | 1 |
| 02:35, 26 February 2016 | Arctangentglyph.png (file) |  |
4 KB | Tom | Category:Arctangentglyph <pre>#!/usr/bin/python import numpy as np import matplotlib.pyplot as plt from mpmath import * from pylab import rcParams rcParams['figure.figsize'] = 2.4,2.4 x=np.arange(-10,10,0.00001) f=np.vectorize(atan) y=f(x) fig, a... | 1 |
| 03:08, 26 February 2016 | Arccosecantglyph.png (file) |  |
4 KB | Tom | Category:Arccosecantglyph <pre>#!/usr/bin/python import numpy as np import matplotlib.pyplot as plt from mpmath import * from pylab import rcParams rcParams['figure.figsize'] = 2.4,2.4 x1=np.arange(1,10,0.001) x2=np.arange(-10,-1,0.001) f=np.vecto... | 1 |
| 03:20, 26 February 2016 | Arcsecantglyph.png (file) | 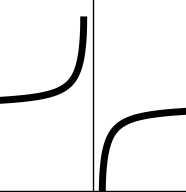 |
4 KB | Tom | Category:Arcsecantglyph <pre>#!/usr/bin/python import numpy as np import matplotlib.pyplot as plt from mpmath import * from pylab import rcParams rcParams['figure.figsize'] = 2.4,2.4 x1=np.arange(1,10,0.00001) x2=np.arange(-10,-1,0.00001) #x=np.co... | 1 |
| 03:28, 26 February 2016 | Arccotangentglyph.png (file) | 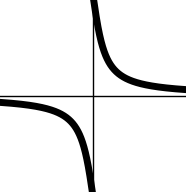 |
4 KB | Tom | Category:Arccotangentglyph <pre>#!/usr/bin/python import numpy as np import matplotlib.pyplot as plt from mpmath import * from pylab import rcParams rcParams['figure.figsize'] = 2.4,2.4 x1=np.arange(-10,-0.000001,0.00001) x2=np.arange(0.000001,10,... | 1 |
| 04:01, 26 February 2016 | Complexarcsineglyph.png (file) |  |
148 KB | Tom | Category:Arcsine <pre>#!/usr/bin/python import numpy as np import matplotlib.pyplot as plt from mpmath import * from pylab import rcParams rcParams['figure.figsize'] = 2.5, 2.5 cplot(lambda x: asin(x),[-2,2],[-2,2],points=400000,verbose=True) plt... | 1 |
| 04:05, 26 February 2016 | Complexarccosine.png (file) |  |
148 KB | Tom | Category:Arccosineglyph <pre>#!/usr/bin/python import numpy as np import matplotlib.pyplot as plt from mpmath import * from pylab import rcParams rcParams['figure.figsize'] = 2.5, 2.5 cplot(lambda x: acos(x),[-2,2],[-2,2],points=400000,verbose=Tr... | 1 |
| 04:10, 26 February 2016 | Complexarctangentglyph.png (file) |  |
148 KB | Tom | Category:Arctangentglyph <pre>#!/usr/bin/python import numpy as np import matplotlib.pyplot as plt from mpmath import * from pylab import rcParams rcParams['figure.figsize'] = 2.5, 2.5 cplot(lambda x: atan(x),[-2,2],[-2,2],points=400000,verbose=T... | 1 |
| 21:41, 27 February 2016 | Complexarccosecantglyph.png (file) |  |
148 KB | Tom | Category:Arccosecant <pre>#!/usr/bin/python import numpy as np import matplotlib.pyplot as plt from mpmath import * from pylab import rcParams rcParams['figure.figsize'] = 2.5, 2.5 cplot(lambda x: acsc(x),[-2,2],[-2,2],points=400000,verbose=True)... | 1 |
| 00:06, 28 February 2016 | Complexarcsecantglyph.png (file) |  |
148 KB | Tom | Category:Arcsecantglyph <pre>#!/usr/bin/python import numpy as np import matplotlib.pyplot as plt from mpmath import * from pylab import rcParams rcParams['figure.figsize'] = 2.5, 2.5 cplot(lambda x: asec(x),[-1,1],[-1,1],points=400000,verbose=Tr... | 1 |
| 00:16, 28 February 2016 | Complexarccotangentglyph.png (file) |  |
148 KB | Tom | Category:Arccotangentglyph <pre>#!/usr/bin/python import numpy as np import matplotlib.pyplot as plt from mpmath import * from pylab import rcParams rcParams['figure.figsize'] = 2.5, 2.5 cplot(lambda x: acot(x),[-3,3],[-3,3],points=400000,verbose... | 1 |
| 22:09, 13 May 2016 | Airysectors.png (file) | 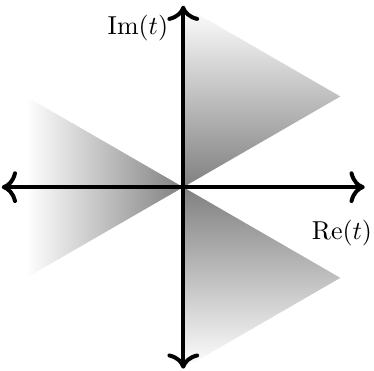 |
11 KB | Tom | <pre>\documentclass{article} \usepackage{tikz} \usepackage{graphicx} \usetikzlibrary{fadings} \begin{document} \begin{tikzpicture}[scale=0.4] \fill[gray,path fading=north] (0,0) -- (4*0.866025,2) -- (0,4) -- cycle; \fill[gray,path fading=west] (0,0) -... | 1 |
| 20:27, 14 May 2016 | Sinhglyph.png (file) |  |
4 KB | Tom | <pre> #!/usr/bin/python import numpy as np import matplotlib.pyplot as plt from mpmath import * from pylab import rcParams rcParams['figure.figsize'] = 2.4,2.4 x=np.arange(-3,3,0.00001) f=np.vectorize(sinh) y=f(x) fig, ax = plt.subplots() #plt.ylim([... | 1 |
| 20:28, 14 May 2016 | Complexsinhglyph.png (file) |  |
148 KB | Tom | Category:Sinhglyph <pre> #!/usr/bin/python import numpy as np import matplotlib.pyplot as plt from mpmath import * from pylab import rcParams rcParams['figure.figsize'] = 2.5, 2.5 cplot(lambda x: sinh(x),[-4,4],[-4,4],points=400000,verbose=True)... | 1 |
| 20:31, 14 May 2016 | Complexcoshglyph.png (file) |  |
148 KB | Tom | Category:Coshglyph <pre> #!/usr/bin/python import numpy as np import matplotlib.pyplot as plt from mpmath import * from pylab import rcParams rcParams['figure.figsize'] = 2.5, 2.5 cplot(lambda x: cosh(x),[-4,4],[-4,4],points=400000,verbose=True)... | 1 |
| 20:32, 14 May 2016 | Complextanhglyph.png (file) |  |
148 KB | Tom | Category:Tanhglyph <pre> #!/usr/bin/python import numpy as np import matplotlib.pyplot as plt from mpmath import * from pylab import rcParams rcParams['figure.figsize'] = 2.5, 2.5 cplot(lambda x: tanh(x),[-4,4],[-4,4],points=400000,verbose=True)... | 1 |
| 20:33, 14 May 2016 | Complexcschglyph.png (file) |  |
19 KB | Tom | Category:Cschglyph <pre> #!/usr/bin/python import numpy as np import matplotlib.pyplot as plt from mpmath import * from pylab import rcParams rcParams['figure.figsize'] = 2.5, 2.5 cplot(lambda x: csch(x),[-4,4],[-4,4],points=400000,verbose=True)... | 1 |
| 20:34, 14 May 2016 | Complexsechglyph.png (file) |  |
18 KB | Tom | Category:Sechglyph <pre> #!/usr/bin/python import numpy as np import matplotlib.pyplot as plt from mpmath import * from pylab import rcParams rcParams['figure.figsize'] = 2.5, 2.5 cplot(lambda x: sech(x),[-4,4],[-4,4],points=400000,verbose=True)... | 1 |
| 20:34, 14 May 2016 | Complexcothglyph.png (file) |  |
18 KB | Tom | Category:Cothglyph <pre>#!/usr/bin/python import numpy as np import matplotlib.pyplot as plt from mpmath import * from pylab import rcParams rcParams['figure.figsize'] = 2.5, 2.5 cplot(lambda x: coth(x),[-4,4],[-4,4],points=400000,verbose=True) p... | 1 |
| 20:35, 14 May 2016 | Coshglyph.png (file) | 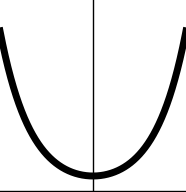 |
5 KB | Tom | Category:Coshglyph <pre>#!/usr/bin/python import numpy as np import matplotlib.pyplot as plt from mpmath import * from pylab import rcParams rcParams['figure.figsize'] = 2.4,2.4 x=np.arange(-3,3,0.00001) f=np.vectorize(cosh) y=f(x) fig, ax = plt.... | 1 |
| 20:36, 14 May 2016 | Tanhglyph.png (file) | 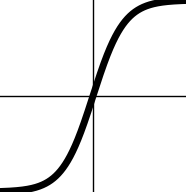 |
4 KB | Tom | Category:Tanhglyph <pre>#!/usr/bin/python import numpy as np import matplotlib.pyplot as plt from mpmath import * from pylab import rcParams rcParams['figure.figsize'] = 2.4,2.4 x=np.arange(-3,3,0.00001) f=np.vectorize(tanh) y=f(x) fig, ax = plt.... | 1 |
| 20:37, 14 May 2016 | Cschglyph.png (file) | 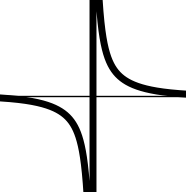 |
4 KB | Tom | Category:Cschglyph <pre>#!/usr/bin/python import numpy as np import matplotlib.pyplot as plt from mpmath import * from pylab import rcParams rcParams['figure.figsize'] = 2.4,2.4 x=np.arange(-3,3,0.000013) f=np.vectorize(csch) y=f(x) fig, ax = plt... | 1 |
| 20:38, 14 May 2016 | Sechglyph.png (file) | 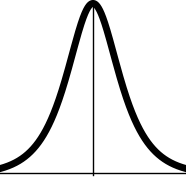 |
6 KB | Tom | Category:Sechglyph <pre>#!/usr/bin/python import numpy as np import matplotlib.pyplot as plt from mpmath import * from pylab import rcParams rcParams['figure.figsize'] = 2.4,2.4 x=np.arange(-4,4,0.00001) f=np.vectorize(sech) y=f(x) fig, ax = plt.... | 1 |
| 01:25, 15 May 2016 | Cothglyph.png (file) | 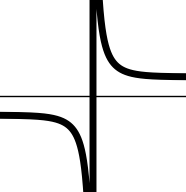 |
4 KB | Tom | Category:Cothglyph <pre>#!/usr/bin/python import numpy as np import matplotlib.pyplot as plt from mpmath import * from pylab import rcParams rcParams['figure.figsize'] = 2.4,2.4 x=np.arange(-3,3,0.000013) f=np.vectorize(coth) y=f(x) fig, ax = plt... | 1 |
| 18:41, 15 May 2016 | Arcsinhglyph.png (file) | 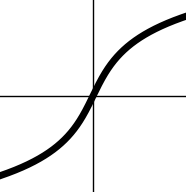 |
5 KB | Tom | Category:Arcsinhglyph <pre>#!/usr/bin/python import numpy as np import matplotlib.pyplot as plt from mpmath import * from pylab import rcParams rcParams['figure.figsize'] = 2.4,2.4 x=np.arange(-6,6,0.001) f=np.vectorize(asinh) y=f(x) fig, ax = pl... | 1 |
First page |
Previous page |
Next page |
Last page |