Difference between revisions of "Format notes"
From specialfunctionswiki
| Line 32: | Line 32: | ||
</gallery> | </gallery> | ||
</div> | </div> | ||
| + | |||
| + | =Mathematica code= | ||
| + | We use the code | ||
| + | <pre>ComplexGraph[f_, {xmin_, xmax_}, {ymin_, ymax_}, | ||
| + | opts : OptionsPattern[]] := | ||
| + | RegionPlot[True, {x, xmin, xmax}, {y, ymin, ymax}, opts, | ||
| + | PlotPoints -> 200, ColorFunctionScaling -> False, | ||
| + | ColorFunction -> | ||
| + | Function[{x, y}, | ||
| + | With[{ff = f[x + I y]}, | ||
| + | ColorConvert[ | ||
| + | Hue[(2. Pi)^-1 Mod[Arg[ff], 2 Pi], 1, | ||
| + | 1 - (1.2 + 10 Log[Abs[ff] + 1])^-1], "LAB"]]]] | ||
| + | </pre> | ||
| + | to generate complex domain colorings. This code comes from | ||
Revision as of 20:33, 19 February 2015
This is a list of common code templates and styles we use at specialfunctionswiki.
Theorem/proof box template
The code
<div class="toccolours mw-collapsible mw-collapsed">
<strong>THEOREM/LEMMA/PROPOSITION:</strong> STATEMENT OF THEOREM
<div class="mw-collapsible-content">
<strong>Proof:</strong> proof goes here █
</div>
</div>
creates
THEOREM/LEMMA/PROPOSITION: STATEMENT OF THEOREM
Proof: proof goes here █
Images
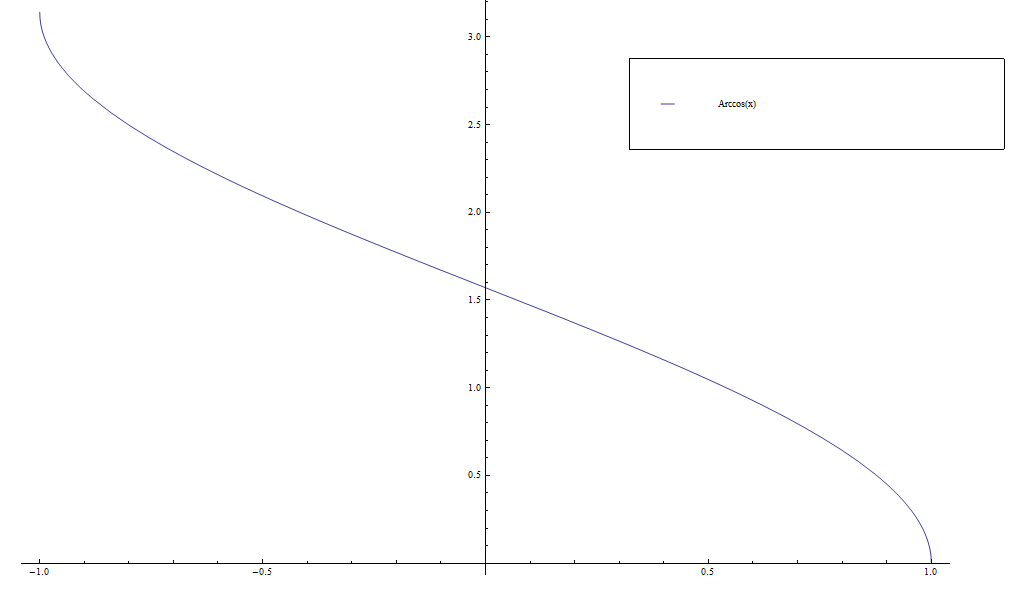
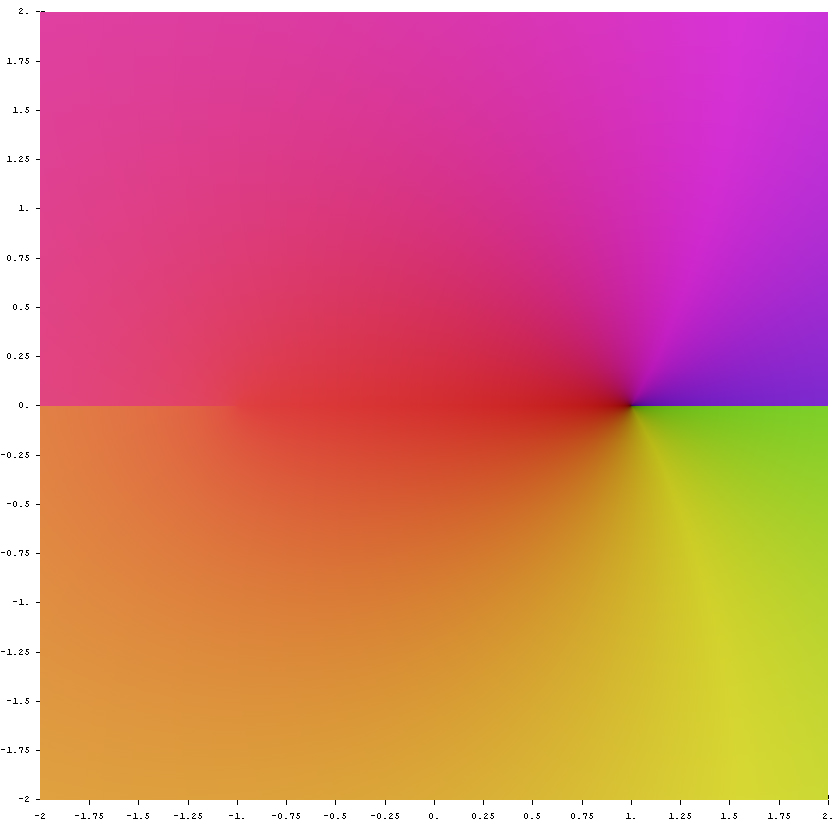
Put images into galleries. Thumbnails and frames break the theorem/proof box template. The code
<div align="center">
<gallery>
File:Arccos.png|Graph of $\mathrm{arccos}$ on $[-1,1]$.
File:Complex arccos.jpg|[[Domain coloring]] of [[analytic continuation]].
</gallery>
</div>
creates
Mathematica code
We use the code
ComplexGraph[f_, {xmin_, xmax_}, {ymin_, ymax_},
  opts : OptionsPattern[]] :=
 RegionPlot[True, {x, xmin, xmax}, {y, ymin, ymax}, opts,
  PlotPoints -> 200, ColorFunctionScaling -> False,
  ColorFunction ->
   Function[{x, y},
    With[{ff = f[x + I y]},
     ColorConvert[
      Hue[(2. Pi)^-1 Mod[Arg[ff], 2 Pi], 1,
       1 - (1.2 + 10 Log[Abs[ff] + 1])^-1], "LAB"]]]]
to generate complex domain colorings. This code comes from

