File list
This special page shows all uploaded files.
First page |
Previous page |
Next page |
Last page |
| Date | Name | Thumbnail | Size | User | Description | Versions |
|---|---|---|---|---|---|---|
| 10:54, 19 January 2015 | Devilstaircasethumb.png (file) | 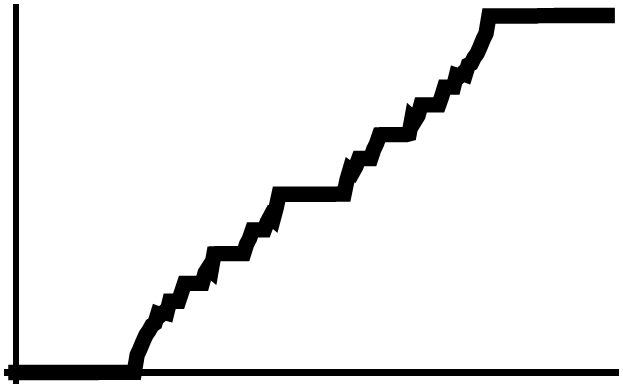 |
7 KB | Tom | f[x_, w_] := x + w + (0.2) Sin[2 Pi x] h[w_] := Nest[f[#, w] &, .1, 1000] data = Table[{w, h[w]}, {w, 0, 1, .005}]; ListPlot[data, Joined -> True, PlotRange -> All, PlotStyle -> {Thickness[0.025], Black}, AxesStyle -> Thickness[0.01], Ticks -> None] | 1 |
| 10:46, 19 January 2015 | Qbinomialthumb.png (file) | 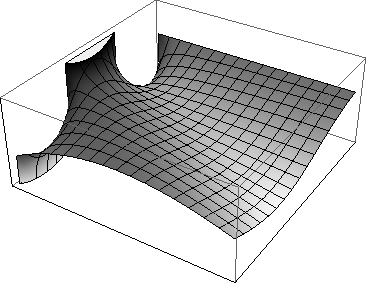 |
30 KB | Tom | Plot3D[QBinomial[x, y, 0.9], {x, -1, 2}, {y, -1, 2}, Ticks -> None, ColorFunction -> GrayLevel, PlotPoints -> 200] | 1 |
| 10:18, 19 January 2015 | Qfactorialthumb.png (file) | 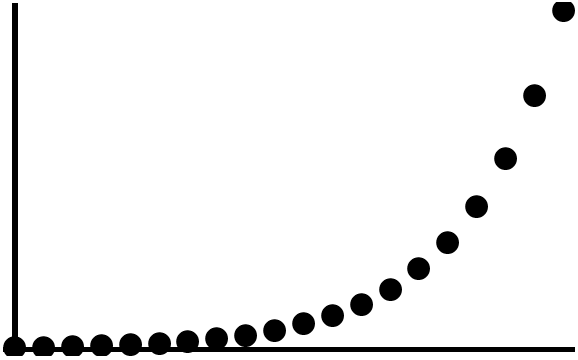 |
6 KB | Tom | DiscretePlot[QFactorial[k, 1/4], {k, 0, 19}, PlotStyle -> {PointSize[0.04], Black}, FillingStyle -> None, AxesStyle -> Thickness[0.01], AxesStyle -> Thickness[0.01], Ticks -> None] | 1 |
| 10:15, 19 January 2015 | Eulerqphi.png (file) | 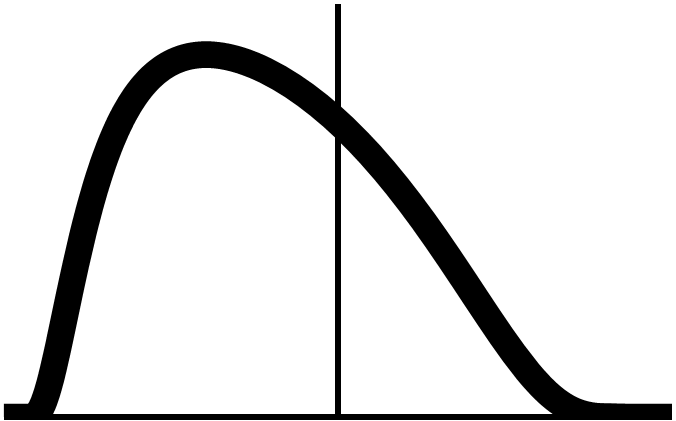 |
11 KB | Tom | Plot[QPochhammer[x], {x, -1, 1}, PlotStyle -> {Thickness[0.04], Black}, AxesStyle -> Thickness[0.01], Ticks -> None, PlotRange -> {0, 1.4}] | 1 |
| 10:10, 19 January 2015 | Qgammathumb.png (file) |  |
10 KB | Tom | Plot[QGamma[x, 2], {x, -5, 5}, PlotStyle -> {Thickness[0.04], Black}, AxesStyle -> Thickness[0.01], Ticks -> None] | 1 |
| 10:04, 19 January 2015 | Lucasthumb.png (file) |  |
10 KB | Tom | Plot[{LucasL[1, x], LucasL[2, x], LucasL[3, x]}, {x, -2, 2}, PlotStyle -> {{Thickness[0.015], Black}, {Thickness[0.015], Black}, {Thickness[0.015], Black}}, AxesStyle -> Thickness[0.01], Ticks -> None] | 1 |
| 10:00, 19 January 2015 | Legendrepthumb.png (file) |  |
18 KB | Tom | Plot[{LegendreP[1, x], LegendreP[2, x], LegendreP[3, x]}, {x, -1, 1}, PlotStyle -> {{Thickness[0.015], Black}, {Thickness[0.015], Black}, {Thickness[0.015], Black}}, AxesStyle -> Thickness[0.01], Ticks -> None] | 1 |
| 09:56, 19 January 2015 | Laguerrelthumb.png (file) |  |
15 KB | Tom | Plot[{LaguerreL[1, x], LaguerreL[2, x], LaguerreL[3, x]}, {x, -4, 7}, PlotStyle -> {{Thickness[0.015], Black}, {Thickness[0.015], Black}, {Thickness[0.015], Black}}, AxesStyle -> Thickness[0.01], Ticks -> None] | 1 |
| 09:38, 19 January 2015 | Jacobipthumb.png (file) | 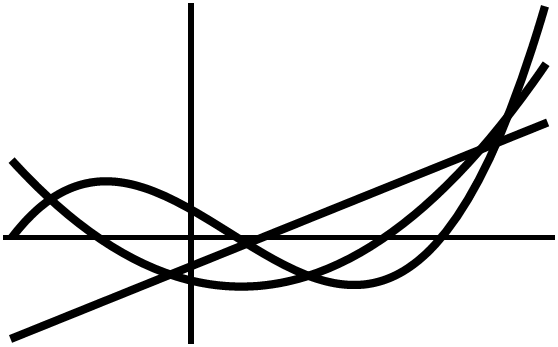 |
12 KB | Tom | Plot[{JacobiP[1, 1, 2, x], JacobiP[2, 1, 2, x], JacobiP[3, 1, 2, x]}, {x, -1/2, 1}, PlotStyle -> {{Thickness[0.015], Black}, {Thickness[0.015], Black}, {Thickness[0.015], Black}}, AxesStyle -> Thickness[0.01], Ticks -> None] | 1 |
| 09:33, 19 January 2015 | Hermitephysthumb.png (file) | 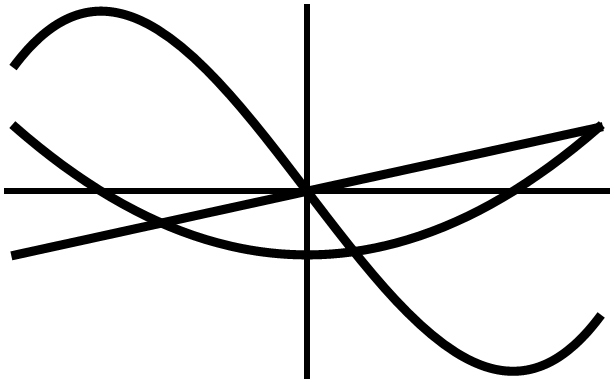 |
15 KB | Tom | Plot[{2 x, 4 x^2 - 2, 8 x^3 - 12 x}, {x, -1, 1}, PlotStyle -> {{Thickness[0.015], Black}, {Thickness[0.015], Black}, {Thickness[0.015], Black}}, AxesStyle -> Thickness[0.01], Ticks -> None] | 1 |
| 09:30, 19 January 2015 | Hermiteprobthumb.png (file) | 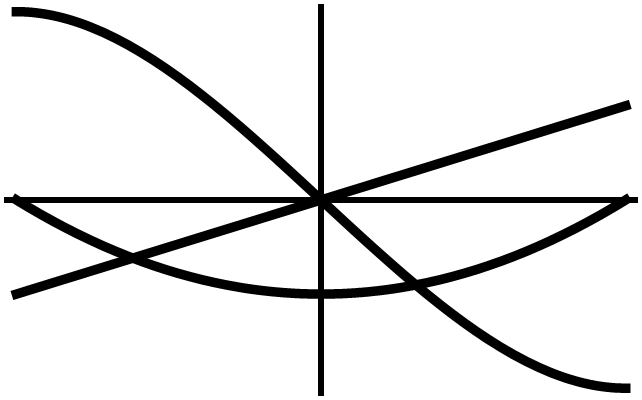 |
14 KB | Tom | Plot[{x, x^2 - 1, x^3 - 3 x}, {x, -1, 1}, PlotStyle -> {{Thickness[0.015], Black}, {Thickness[0.015], Black}, {Thickness[0.015], Black}}, AxesStyle -> Thickness[0.01], Ticks -> None] | 1 |
| 09:24, 19 January 2015 | Gegenbauercthumb.png (file) | 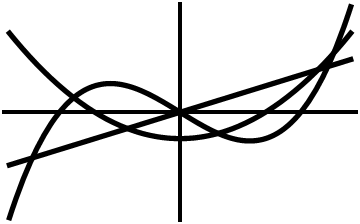 |
8 KB | Tom | Plot[{GegenbauerC[1, 1, x], GegenbauerC[2, 1, x], GegenbauerC[3, 1, x]}, {x, -1, 1}, PlotStyle -> {{Thickness[0.015], Black}, {Thickness[0.015], Black}, {Thickness[0.015], Black}}, AxesStyle -> Thickness[0.01], Ticks -> None] | 1 |
| 09:20, 19 January 2015 | Fibonaccithumb.png (file) | 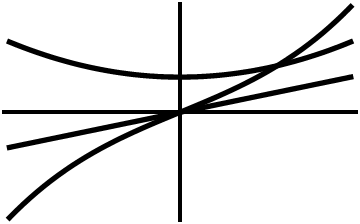 |
7 KB | Tom | Plot[{Fibonacci[4, x], Fibonacci[2, x], Fibonacci[3, x]}, {x, -1, 1}, PlotStyle -> {{Thickness[0.015], Black}, {Thickness[0.015], Black}, {Thickness[0.015], Black}}, AxesStyle -> Thickness[0.01], Ticks -> None] | 1 |
| 09:18, 19 January 2015 | Eulerethumb.png (file) | 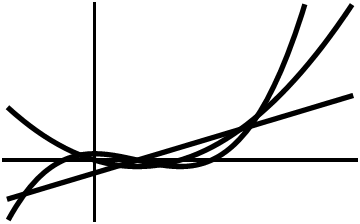 |
7 KB | Tom | Plot[{EulerE[1, x], EulerE[2, x], EulerE[3, x]}, {x, -1, 3}, PlotStyle -> {{Thickness[0.015], Black}, {Thickness[0.015], Black}, {Thickness[0.015], Black}}, AxesStyle -> Thickness[0.01], Ticks -> None] | 1 |
| 09:15, 19 January 2015 | Dicksonthumb.png (file) | 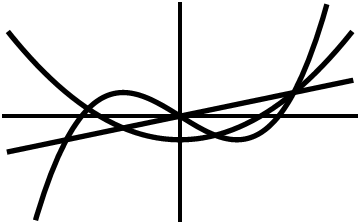 |
8 KB | Tom | Plot[{x, x^2 - 2, x^3 - 3 x}, {x, -3, 3}, PlotStyle -> {{Thickness[0.015], Black}, {Thickness[0.015], Black}, {Thickness[0.015], Black}}, AxesStyle -> Thickness[0.01], Ticks -> None] | 1 |
| 09:12, 19 January 2015 | Chebyshevuthumb.png (file) | 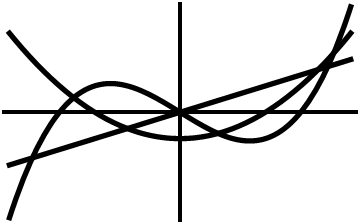 |
8 KB | Tom | Plot[{ChebyshevU[1, x], ChebyshevU[2, x], ChebyshevU[3, x]}, {x, -1, 1}, PlotStyle -> {{Thickness[0.015], Black}, {Thickness[0.015], Black}, {Thickness[0.015], Black}}, AxesStyle -> Thickness[0.01], Ticks -> None] | 1 |
| 09:07, 19 January 2015 | Besselpolynomialsthumb.png (file) | 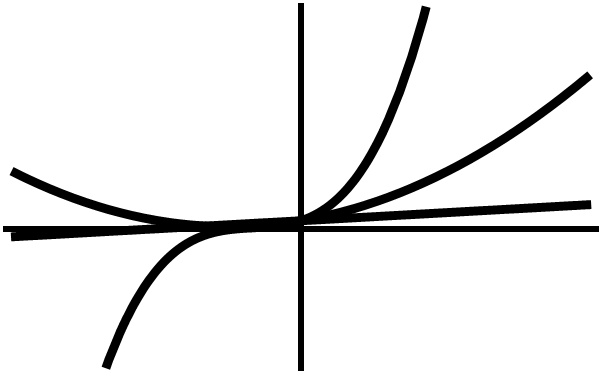 |
11 KB | Tom | Plot[{x + 1, 3 x^2 + 3 x + 1, 15 x^3 + 15 x^2 + 6 x + 1}, {x, -2, 2}, PlotStyle -> {{Thickness[0.015], Black}, {Thickness[0.015], Black}, {Thickness[0.015], Black}}, AxesStyle -> Thickness[0.01], Ticks -> None] | 1 |
| 09:03, 19 January 2015 | Abelpolynomialthumb.png (file) | 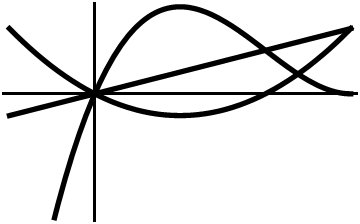 |
7 KB | Tom | Plot[{x, -2 x + x^2, 9 x - 6 x^2 + x^3}, {x, -1, 3}, PlotStyle -> {{Thickness[0.015], Black}, {Thickness[0.015], Black}, {Thickness[0.015], Black}}, AxesStyle -> Thickness[0.01], Ticks -> None] | 1 |
| 08:58, 19 January 2015 | Bernoullibthumb.png (file) | 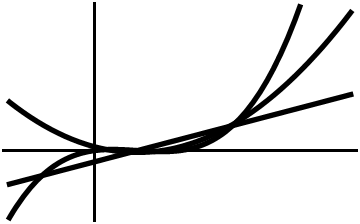 |
7 KB | Tom | Plot[{BernoulliB[1, x], BernoulliB[2, x], BernoulliB[3, x]}, {x, -1, 3}, PlotStyle -> {{Thickness[0.015], Black}, {Thickness[0.015], Black}, {Thickness[0.015], Black}}, AxesStyle -> Thickness[0.01], Ticks -> None] | 1 |
| 08:53, 19 January 2015 | Associatedlaguerrelthumb.png (file) | 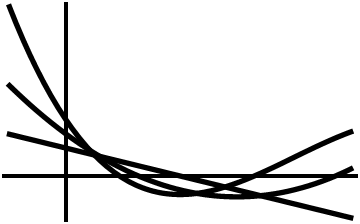 |
7 KB | Tom | Plot[{LaguerreL[1, 1, x], LaguerreL[2, 1, x], LaguerreL[3, 1, x]}, {x, -1, 5}, PlotStyle -> {{Thickness[0.015], Black}, {Thickness[0.015], Black}, {Thickness[0.015], Black}}, AxesStyle -> Thickness[0.01], Ticks -> None] | 1 |
| 08:49, 19 January 2015 | Batemanpolynomialthumb.png (file) | 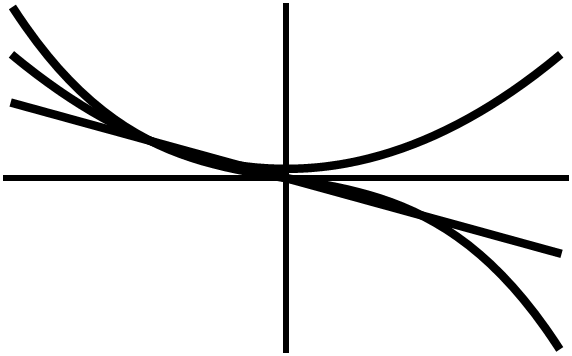 |
11 KB | Tom | Plot[{-x, 1/4 + (3/4) x^2, (-7/12) x - (5/12) x^3}, {x, -2, 2}, PlotStyle -> {{Thickness[0.015], Black}, {Thickness[0.015], Black}, {Thickness[0.015], Black}}, AxesStyle -> Thickness[0.01], Ticks -> None] | 1 |
| 08:41, 19 January 2015 | Planckradiationthumb.png (file) | 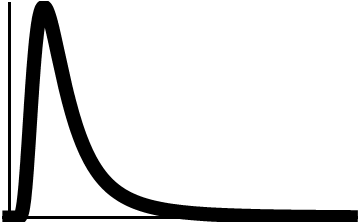 |
5 KB | Tom | Plot[(15/Pi^4)*1/(x^5*(Exp[1/x] - 1)), {x, 0, 2}, PlotStyle -> {Thickness[0.04], Black}, AxesStyle -> Thickness[0.01], Ticks -> None] | 1 |
| 08:36, 19 January 2015 | Riemannxithumb.png (file) | 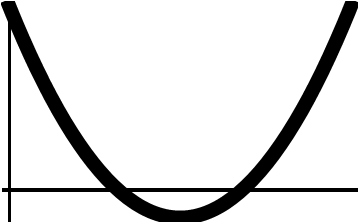 |
6 KB | Tom | Using RiemannXi[z_] := (1/2)*z*(z - 1)*Pi^(-z/2)*Gamma[z/2]*Zeta[z] and the code Plot[RiemannXi[x], {x, 0, 1}, PlotStyle -> {Thickness[0.04], Black}, AxesStyle -> Thickness[0.01], Ticks -> None] | 1 |
| 08:29, 19 January 2015 | Partitionthumb.png (file) | 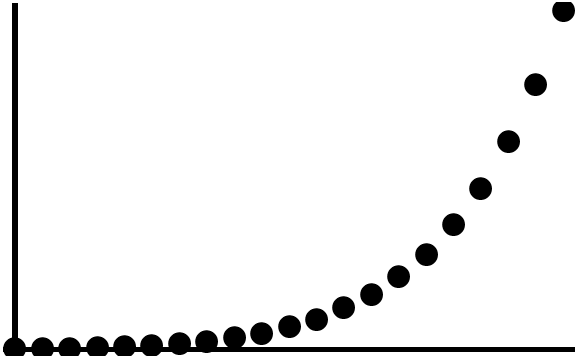 |
6 KB | Tom | DiscretePlot[PartitionsP[k], {k, 0, 20}, PlotStyle -> {PointSize[0.04], Black}, FillingStyle -> None, AxesStyle -> Thickness[0.01], AxesStyle -> Thickness[0.01], Ticks -> None] | 1 |
| 08:24, 19 January 2015 | Minkowskiqmthumb.png (file) | 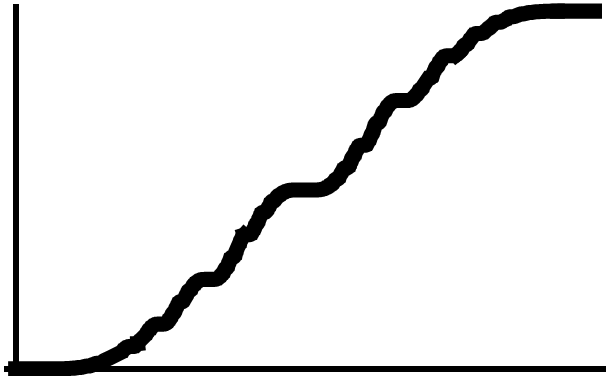 |
8 KB | Tom | Using qm[x_] := Abs@Fold[#2 - #1 &, Floor@x, 2*2^-Accumulate@Rest@ContinuedFraction@x] and Plot[qm[x], {x, 0, 1}, PlotStyle -> {Thickness[0.025], Black}, AxesStyle -> Thickness[0.01], Ticks -> None] | 1 |
| 08:17, 19 January 2015 | Hadamardgammathumb.png (file) | 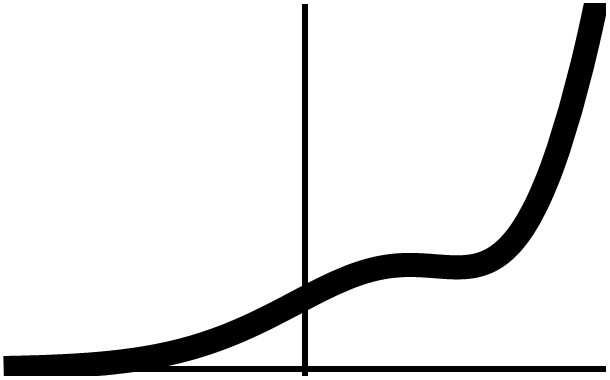 |
7 KB | Tom | Using HadamardGamma[ z_] := (PolyGamma[1 - z/2] - PolyGamma[1/2 - z/2])/(2*Gamma[1 - z]) and the command Plot[HadamardGamma[x], {x, -3.5, 3.5}, PlotStyle -> {Thickness[0.04], Black}, AxesStyle -> Thickness[0.01], Ticks -> None] | 1 |
| 08:14, 19 January 2015 | Dirichletetathumb.png (file) | 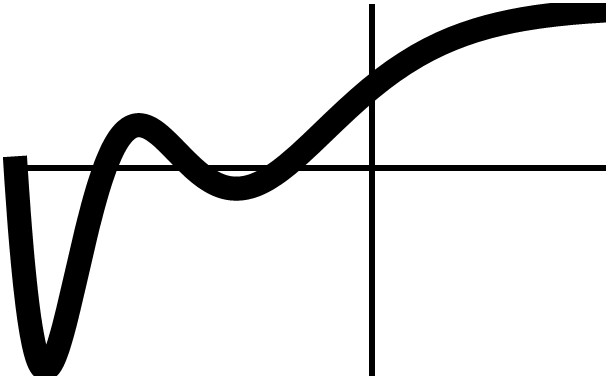 |
9 KB | Tom | Using DirichletEta[z_] := (1 - 2^(1 - z)) Zeta[z] and the command Plot[DirichletEta[x], {x, -8, 5}, PlotStyle -> {Thickness[0.04], Black}, AxesStyle -> Thickness[0.01], Ticks -> None] | 1 |
| 08:09, 19 January 2015 | Dirichletbetathumb.png (file) | 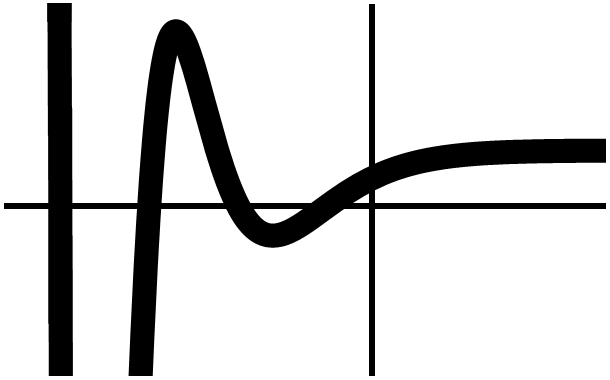 |
8 KB | Tom | using DirichletBeta[z_] := 2^(-z) LerchPhi[-1, z, 1/2] and the command Plot[DirichletBeta[x], {x, -8, 5}, PlotStyle -> {Thickness[0.04], Black}, AxesStyle -> Thickness[0.01], Ticks -> None] | 1 |
| 07:55, 19 January 2015 | Reciprocalgammathumb.png (file) | 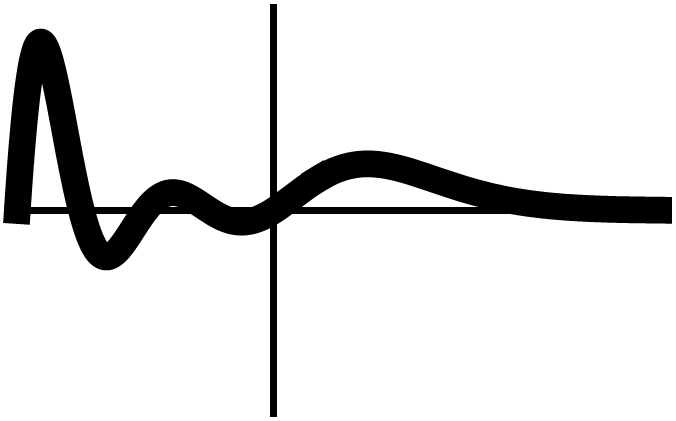 |
9 KB | Tom | Plot[1/Gamma[x], {x, -4.0, 6}, PlotStyle -> {Thickness[0.04], Black}, AxesStyle -> Thickness[0.01], Ticks -> None, PlotRange -> {-5, 5}] | 1 |
| 07:48, 19 January 2015 | Polylog1thumb.png (file) | 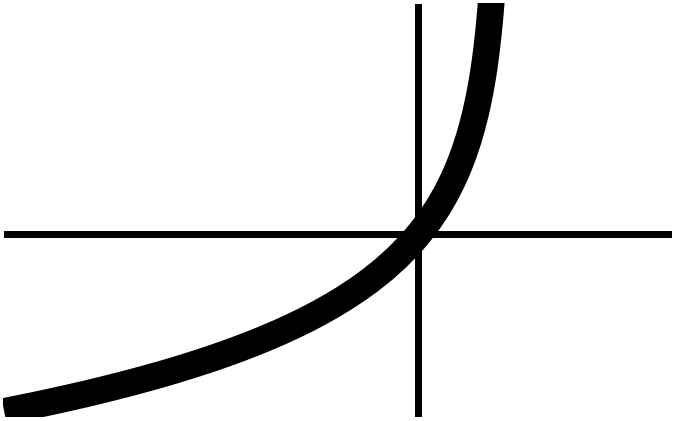 |
7 KB | Tom | Plot[PolyLog[1, x], {x, -5, 3}, PlotStyle -> {Thickness[0.04], Black}, AxesStyle -> Thickness[0.01], Ticks -> None] | 1 |
| 07:44, 19 January 2015 | Thomaethumb.png (file) | 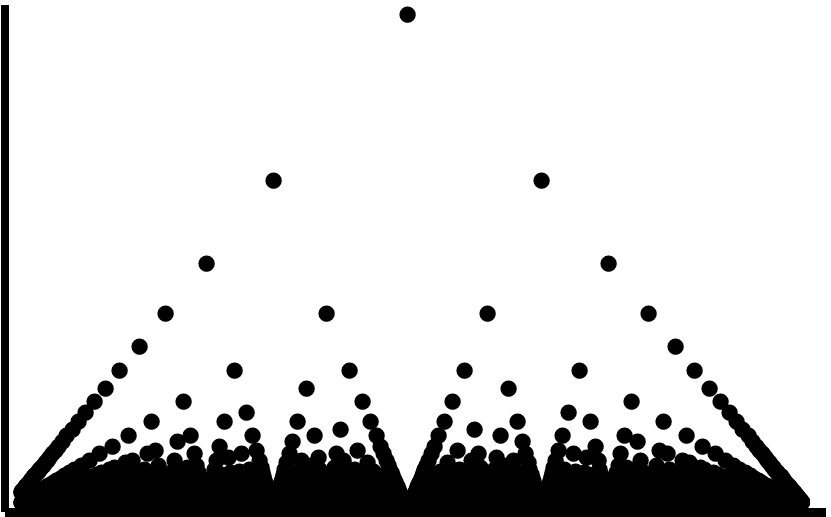 |
14 KB | Tom | Using [http://mathematica.stackexchange.com/questions/5489/how-do-i-plot-thomaes-function-in-mathematica this implementation] with ListPlot[pq, PlotRange -> {0, 0.51}, PlotStyle -> {PointSize[0.02], Black}, FillingStyle -> None, AxesStyle -> Thic... | 1 |
| 07:36, 19 January 2015 | Lithumb.png (file) | 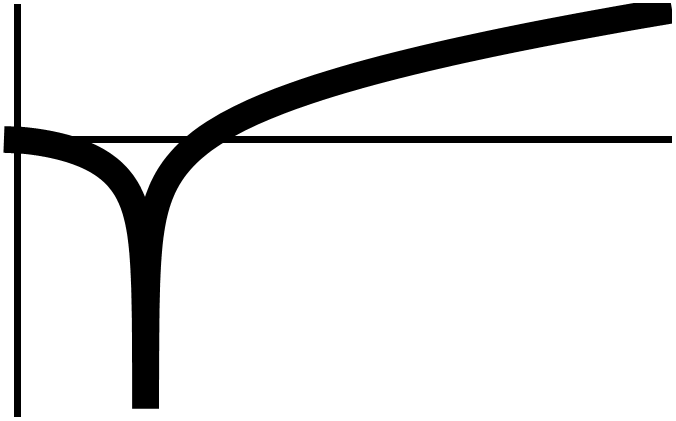 |
7 KB | Tom | Plot[LogIntegral[x], {x, 0, 5}, PlotStyle -> {Thickness[0.04], Black}, AxesStyle -> Thickness[0.01], Ticks -> None] | 1 |
| 07:34, 19 January 2015 | Logthumb.png (file) | 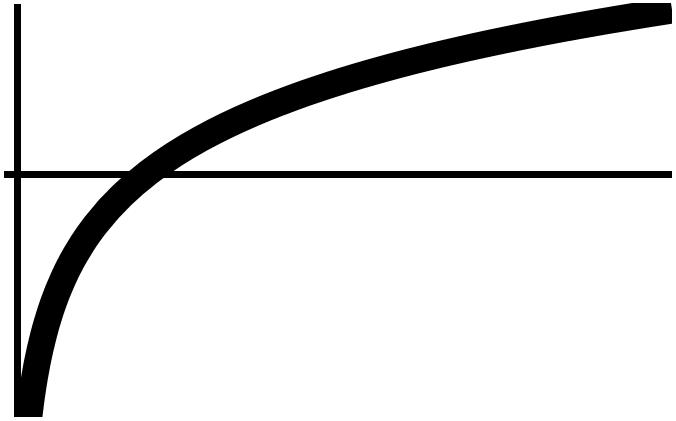 |
8 KB | Tom | Plot[Log[x], {x, 0, 5}, PlotStyle -> {Thickness[0.04], Black}, AxesStyle -> Thickness[0.01], Ticks -> None] | 1 |
| 07:29, 19 January 2015 | Hypergeometricthumb.png (file) | 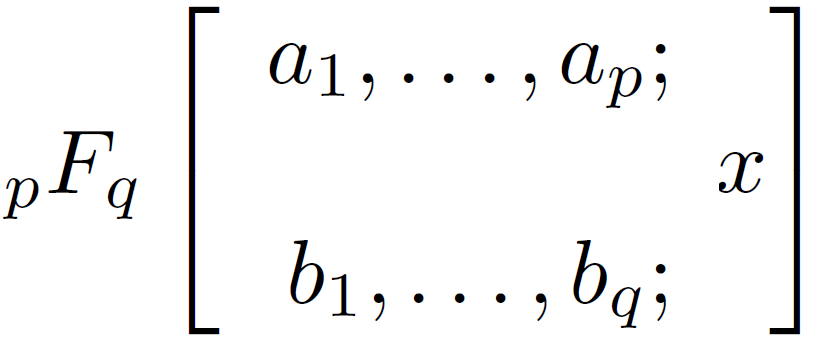 |
15 KB | Tom | 1 | |
| 07:21, 19 January 2015 | Gammathumb.png (file) | 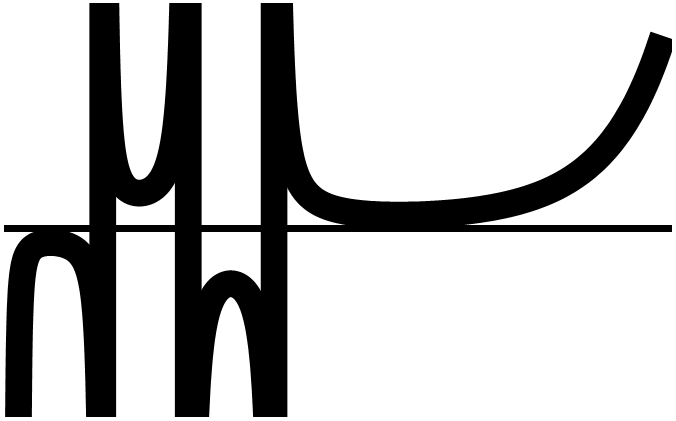 |
10 KB | Tom | Plot[Gamma[x], {x, -3, 4.5}, PlotStyle -> {Thickness[0.04], Black}, AxesStyle -> Thickness[0.01], Ticks -> None] | 1 |
| 07:20, 19 January 2015 | Factorialthumb.png (file) | 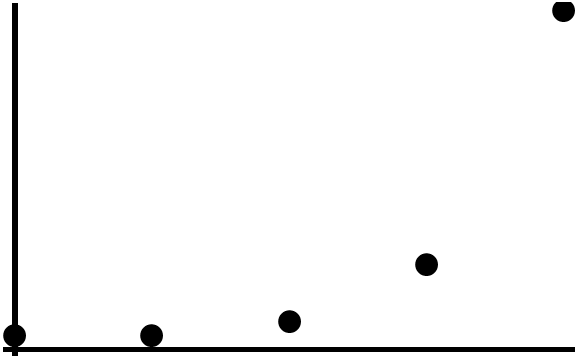 |
3 KB | Tom | DiscretePlot[k!, {k, 0, 4}, PlotStyle -> {PointSize[0.04], Black}, FillingStyle -> None, AxesStyle -> Thickness[0.01], AxesStyle -> Thickness[0.01], Ticks -> None] | 1 |
| 07:17, 19 January 2015 | Eithumb.png (file) |  |
10 KB | Tom | Plot[ExpIntegralEi[x], {x, -1, 1}, PlotStyle -> {Thickness[0.04], Black}, AxesStyle -> Thickness[0.01], Ticks -> None] | 1 |
| 07:14, 19 January 2015 | Expthumb.png (file) | 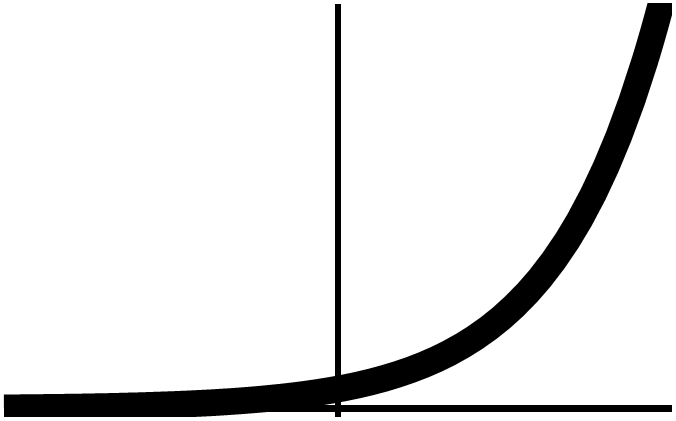 |
8 KB | Tom | Plot[Exp[x], {x, -3, 3}, PlotStyle -> {Thickness[0.04], Black}, AxesStyle -> Thickness[0.01], Ticks -> None] | 1 |
| 07:13, 19 January 2015 | Erfthumb.png (file) | 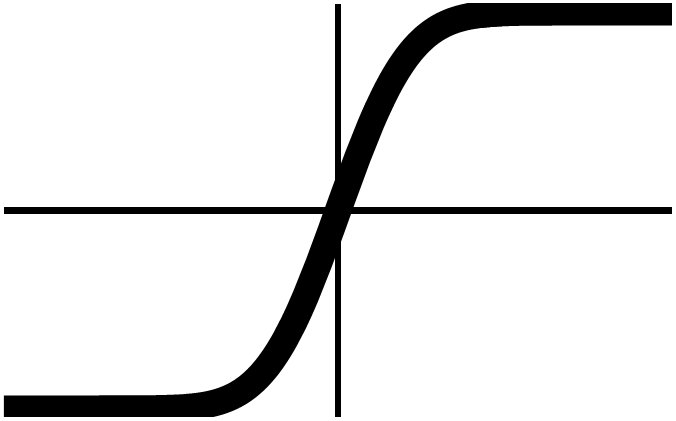 |
7 KB | Tom | Plot[Erf[x], {x, -4, 4}, PlotStyle -> {Thickness[0.04], Black}, AxesStyle -> Thickness[0.01], Ticks -> None] | 1 |
| 07:07, 19 January 2015 | Dedekindetathumb.png (file) | 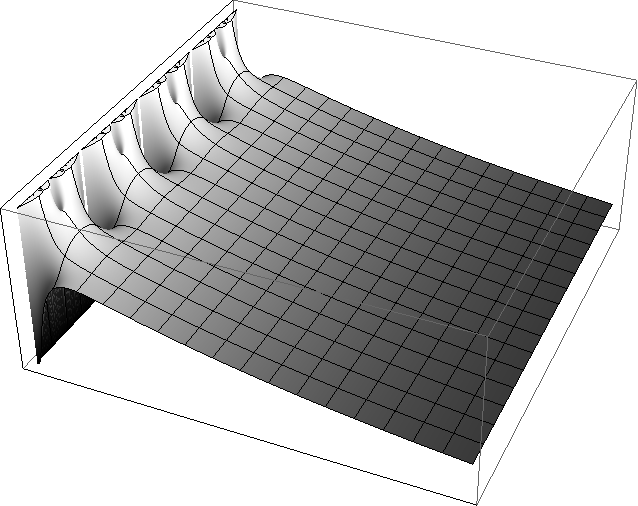 |
69 KB | Tom | Plot3D[Abs[DedekindEta[x + I*y]], {x, -2, 2}, {y, 0, 5}, Ticks -> None, ColorFunction -> GrayLevel, PlotPoints -> 500] | 1 |
| 06:58, 19 January 2015 | Betathumb.png (file) | 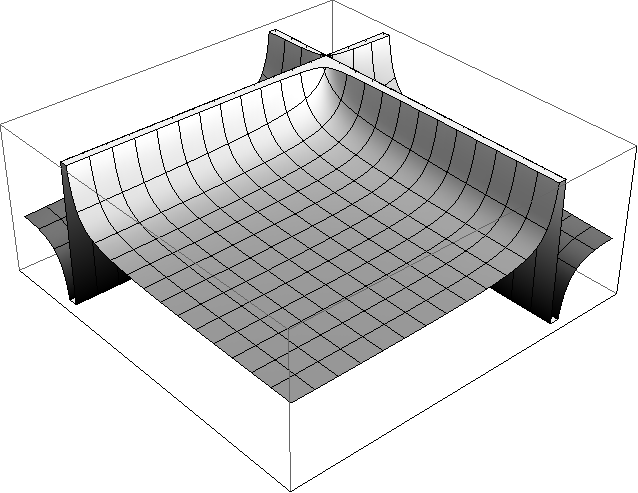 |
49 KB | Tom | Plot3D[Beta[x, y], {x, -0.5, 2}, {y, -0.5, 2}, PlotPoints -> {200}, Ticks -> None, ColorFunction -> GrayLevel] | 1 |
| 06:52, 19 January 2015 | Digammathumb.png (file) | 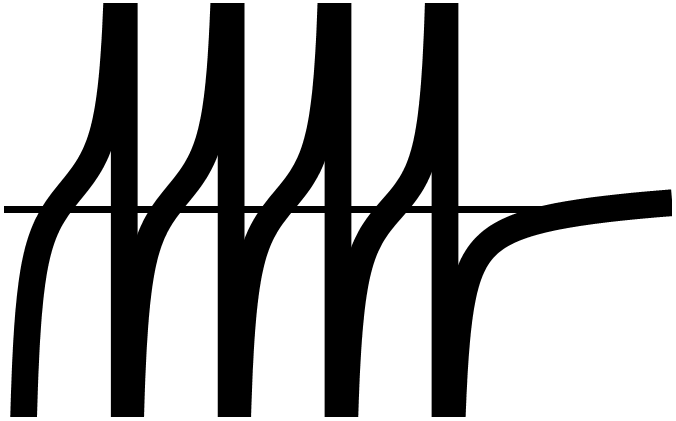 |
11 KB | Tom | Plot[PolyGamma[x], {x, -4, 2}, PlotStyle -> {Thickness[0.04], Black}, AxesStyle -> Thickness[0.01], Ticks -> None] | 1 |
| 06:46, 19 January 2015 | Binomialthumb.png (file) | 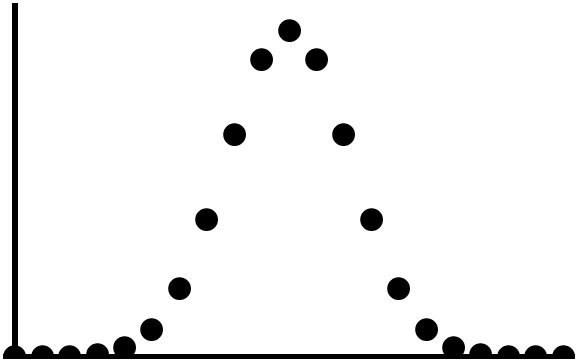 |
5 KB | Tom | DiscretePlot[Binomial[20, k], {k, 0, 20}, PlotStyle -> {PointSize[0.04], Black}, PlotRange -> {0, 200000}, FillingStyle -> None, AxesStyle -> Thickness[0.01], AxesStyle -> Thickness[0.01], Ticks -> None] | 1 |
| 06:35, 19 January 2015 | Besselj0thumb.png (file) | 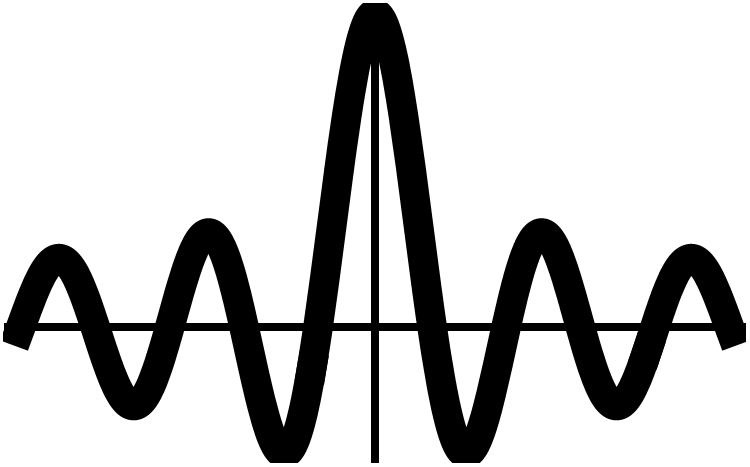 |
18 KB | Tom | Plot[BesselJ[0, x], {x, -15, 15}, PlotStyle -> {Thickness[0.04], Black}, AxesStyle -> Thickness[0.01], Ticks -> None] | 1 |
| 06:32, 19 January 2015 | Airyaithumb.png (file) | 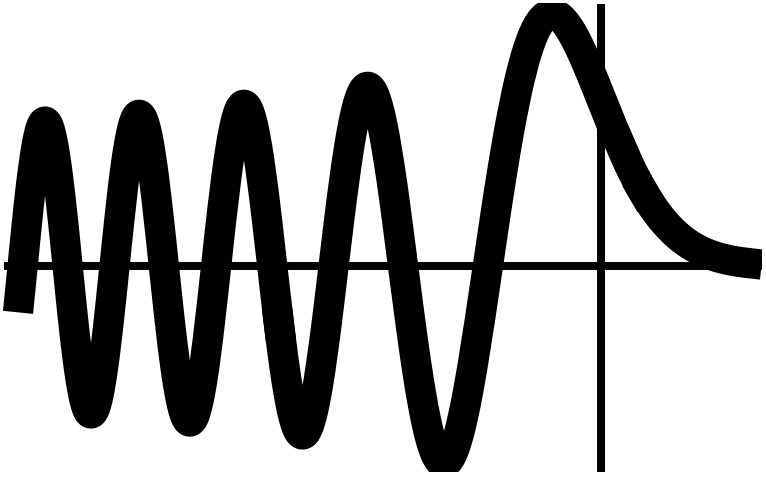 |
21 KB | Tom | Plot[AiryAi[x], {x, -12, 3}, PlotStyle -> {Thickness[0.04], Black}, AxesStyle -> Thickness[0.01], Ticks -> None] | 1 |
| 04:50, 19 January 2015 | Arccoththumb.png (file) | 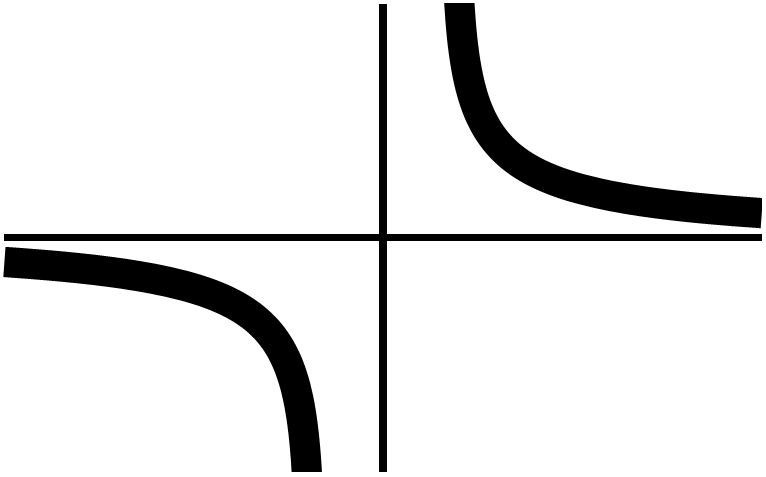 |
10 KB | Tom | Plot[ArcCoth[x], {x, -5, 5}, PlotStyle -> {Thickness[0.04], Black}, AxesStyle -> Thickness[0.01], Ticks -> None] | 1 |
| 04:50, 19 January 2015 | Arcsechthumb.png (file) | 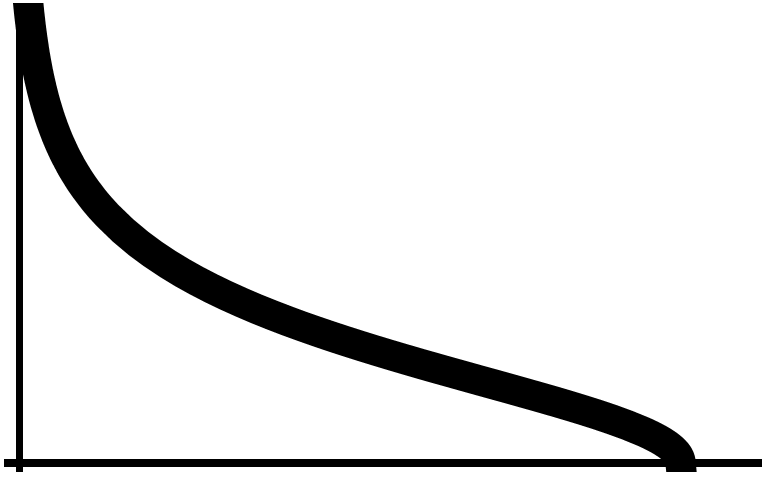 |
9 KB | Tom | Plot[ArcSech[x], {x, 0, 1.1}, PlotStyle -> {Thickness[0.04], Black}, AxesStyle -> Thickness[0.01], Ticks -> None] | 1 |
| 04:48, 19 January 2015 | Arccschthumb.png (file) | 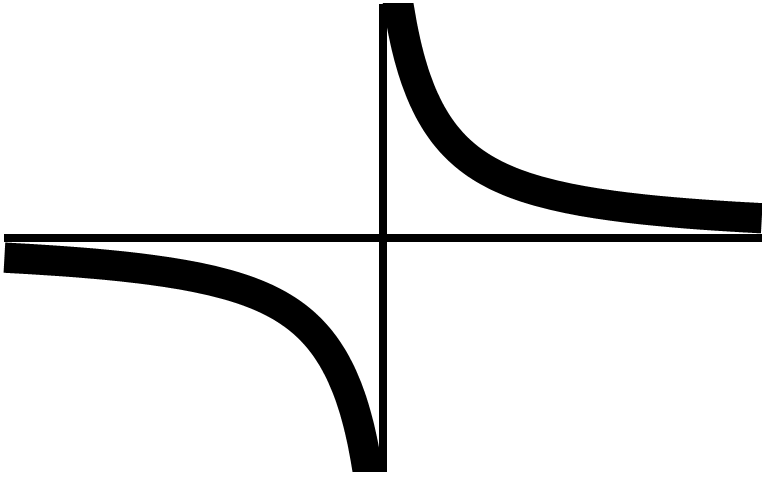 |
10 KB | Tom | Plot[ArcCsch[x], {x, -5, 5}, PlotStyle -> {Thickness[0.04], Black}, AxesStyle -> Thickness[0.01], Ticks -> None] | 1 |
| 04:47, 19 January 2015 | Arctanhthumb.png (file) | 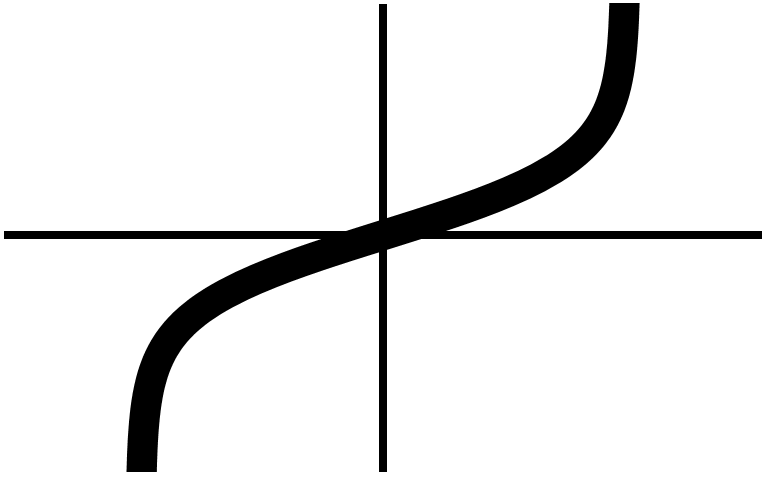 |
9 KB | Tom | Plot[ArcTanh[x], {x, -1.5, 1.5}, PlotStyle -> {Thickness[0.04], Black}, AxesStyle -> Thickness[0.01], Ticks -> None] | 1 |
| 04:46, 19 January 2015 | Arccoshthumb.png (file) | 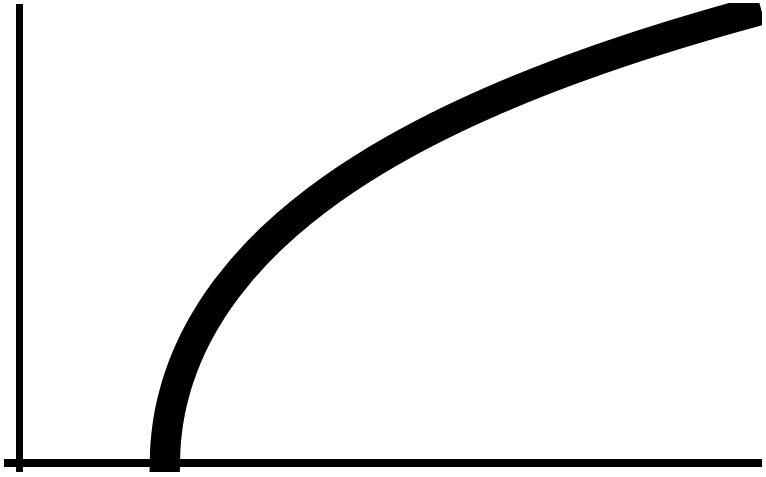 |
9 KB | Tom | Plot[ArcCosh[x], {x, 0, 5}, PlotStyle -> {Thickness[0.04], Black}, AxesStyle -> Thickness[0.01], Ticks -> None] | 1 |
First page |
Previous page |
Next page |
Last page |