File list
This special page shows all uploaded files.
First page |
Previous page |
Next page |
Last page |
| Date | Name | Thumbnail | Size | Description | Versions |
|---|---|---|---|---|---|
| 20:53, 21 June 2016 | Dodecagonalnumber12glyph.png (file) | 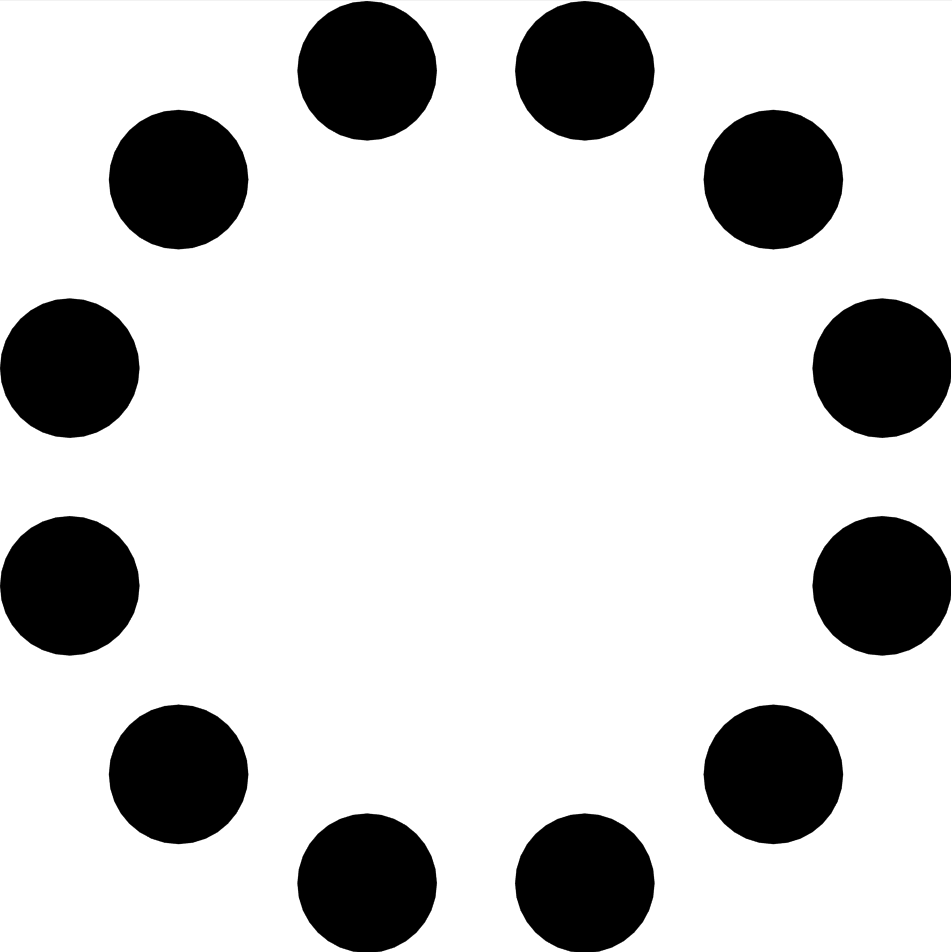 |
35 KB | Category:dodecagonalnumbersglyph <pre>\documentclass[tikz]{standalone} \usetikzlibrary{shapes.geometric,calc} \begin{document} \begin{tikzpicture} \node (pol) [minimum size=\textwidth,regular polygon, regular polygon sides=12,color=white] at (0,... | 1 |
| 20:50, 21 June 2016 | Hendecagonalnumber11.png (file) | 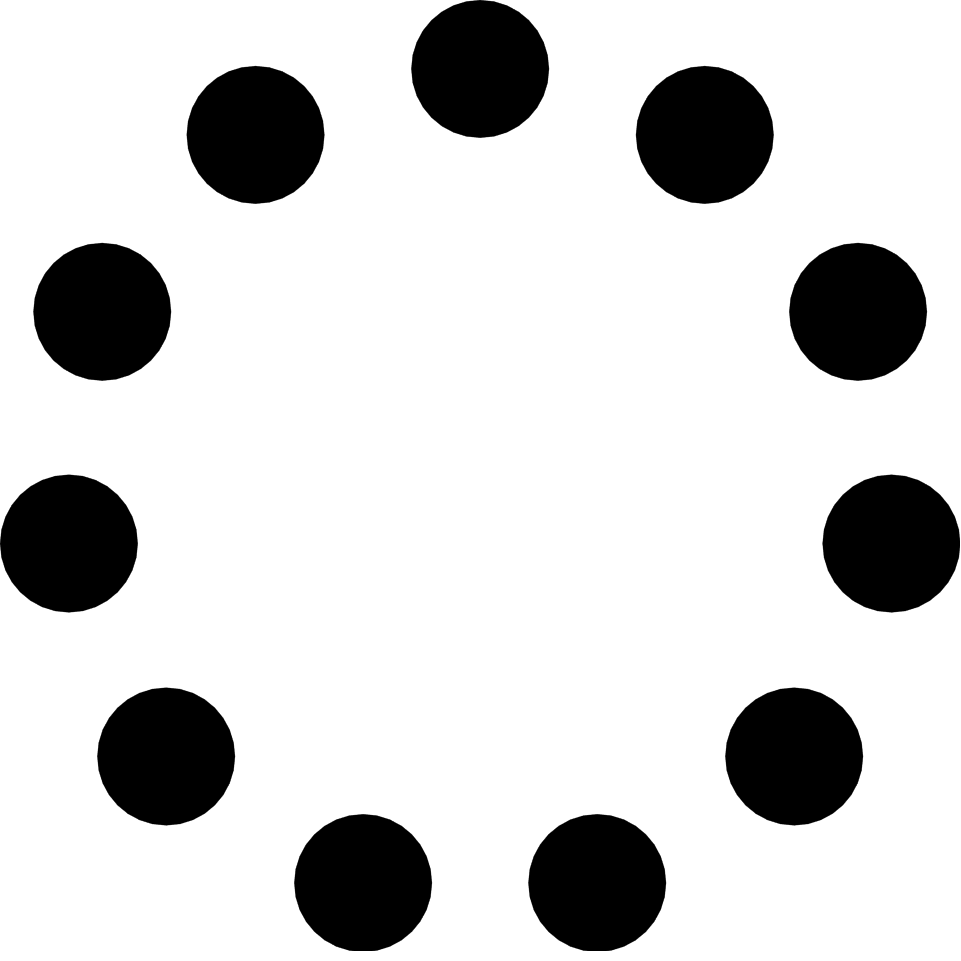 |
33 KB | Category:hendecagonalnumbersglyph <pre>\documentclass[tikz]{standalone} \usetikzlibrary{shapes.geometric,calc} \begin{document} \begin{tikzpicture} \node (pol) [minimum size=\textwidth,regular polygon, regular polygon sides=11,color=white] at (0... | 1 |
| 20:45, 21 June 2016 | First six triangular numbers.svg (file) |  |
38 KB | From [https://en.wikipedia.org/wiki/Triangular_number#/media/File:First_six_triangular_numbers.svg Wikipedia] | 1 |
| 20:39, 21 June 2016 | Decagonalnumber10.png (file) |  |
32 KB | Category:decagonalnumbersglyph <pre>\documentclass[tikz]{standalone} \usetikzlibrary{shapes.geometric,calc} \begin{document} \begin{tikzpicture} \node (pol) [minimum size=\textwidth,regular polygon, regular polygon sides=10,color=white] at (0,0)... | 1 |
| 20:35, 21 June 2016 | Nonagonalnumber9glyph.png (file) |  |
29 KB | Category:nonagonalnumbersglyph <pre>\documentclass[tikz]{standalone} \usetikzlibrary{shapes.geometric,calc} \begin{document} \begin{tikzpicture} \node (pol) [minimum size=\textwidth,regular polygon, regular polygon sides=9,color=white] at (0,0)... | 1 |
| 20:32, 21 June 2016 | Octagonalnumber8glyph.png (file) |  |
18 KB | Category:octagonalnumbersglyph <pre>\documentclass[tikz]{standalone} \usetikzlibrary{shapes.geometric,calc} \begin{document} \begin{tikzpicture} \node (pol) [minimum size=\textwidth,regular polygon, regular polygon sides=8,color=white] at (0,0)... | 1 |
| 20:28, 21 June 2016 | Heptagonalnumber7glyph.png (file) | 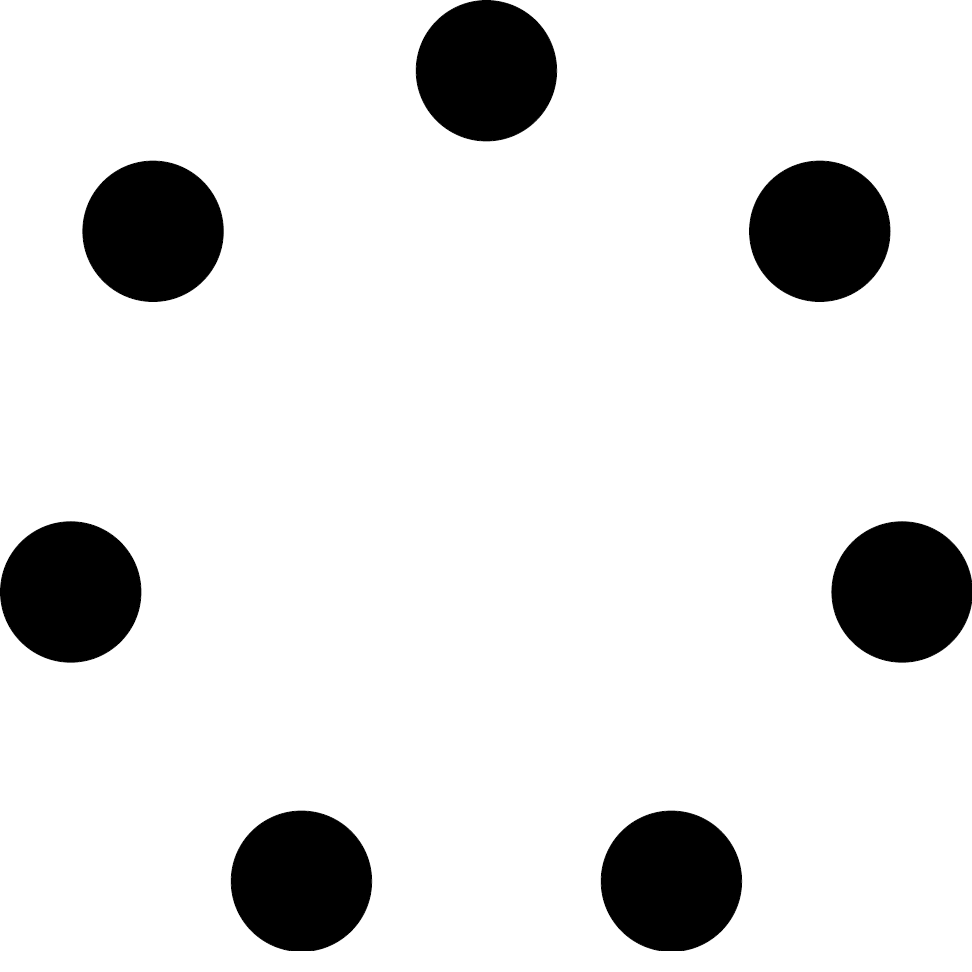 |
17 KB | Category:Heptagonalnumbersglyph <pre>\documentclass[tikz]{standalone} \usetikzlibrary{shapes.geometric,calc} \begin{document} \begin{tikzpicture} \node (pol) [minimum size=\textwidth,regular polygon, regular polygon sides=7,color=white] at (0,0)... | 1 |
| 20:01, 21 June 2016 | Hexagonalnumber6glyph.png (file) | 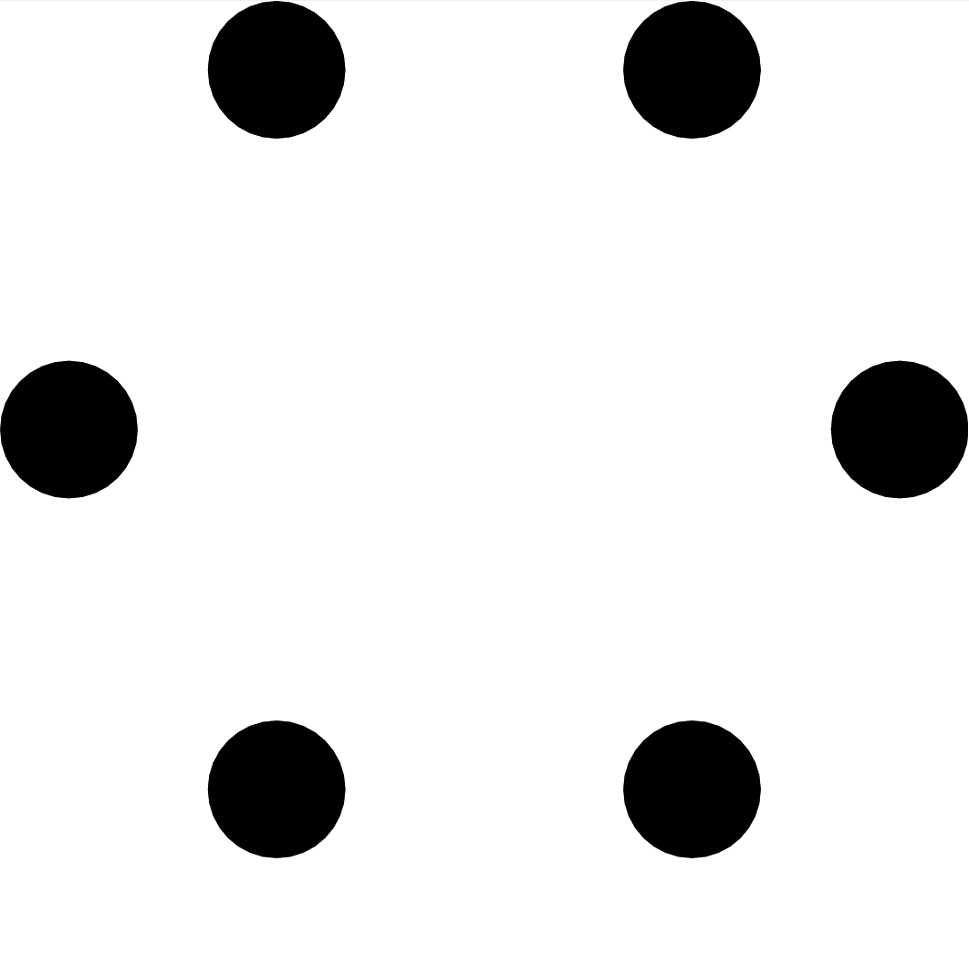 |
24 KB | Category:hexagonalnumbers <pre>\documentclass[tikz]{standalone} \usetikzlibrary{shapes.geometric,calc} \begin{document} \begin{tikzpicture} \node (pol) [minimum size=\textwidth,regular polygon, regular polygon sides=6,color=white] at (0,0) {};... | 2 |
| 19:54, 21 June 2016 | Pentagonalnumber5glyph.png (file) | 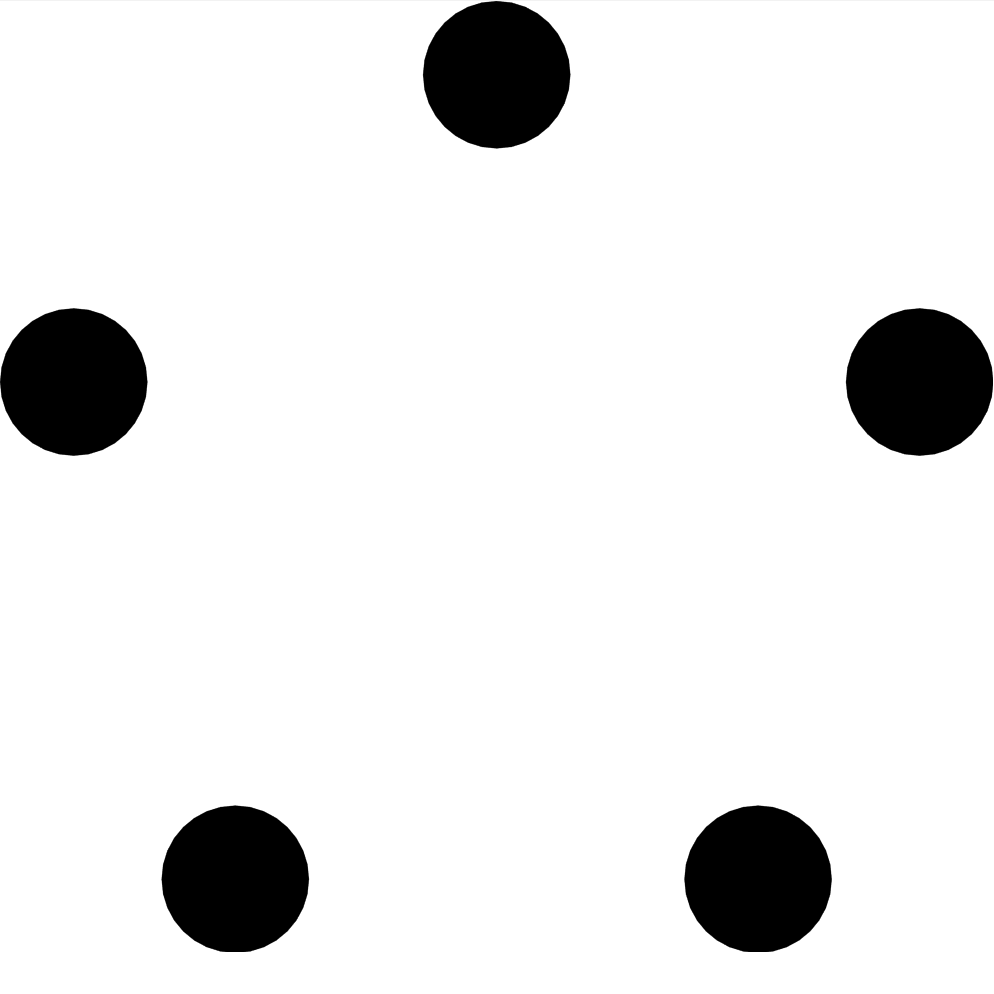 |
21 KB | Category:Pentagonalnumbersglyph <pre>\documentclass[tikz]{standalone} \usetikzlibrary{shapes.geometric,calc} \begin{document} \begin{tikzpicture} \node (pol) [minimum size=\textwidth,regular polygon, regular polygon sides=5,color=white] at (0,0)... | 2 |
| 19:50, 21 June 2016 | Squarenumber4glyph.png (file) | 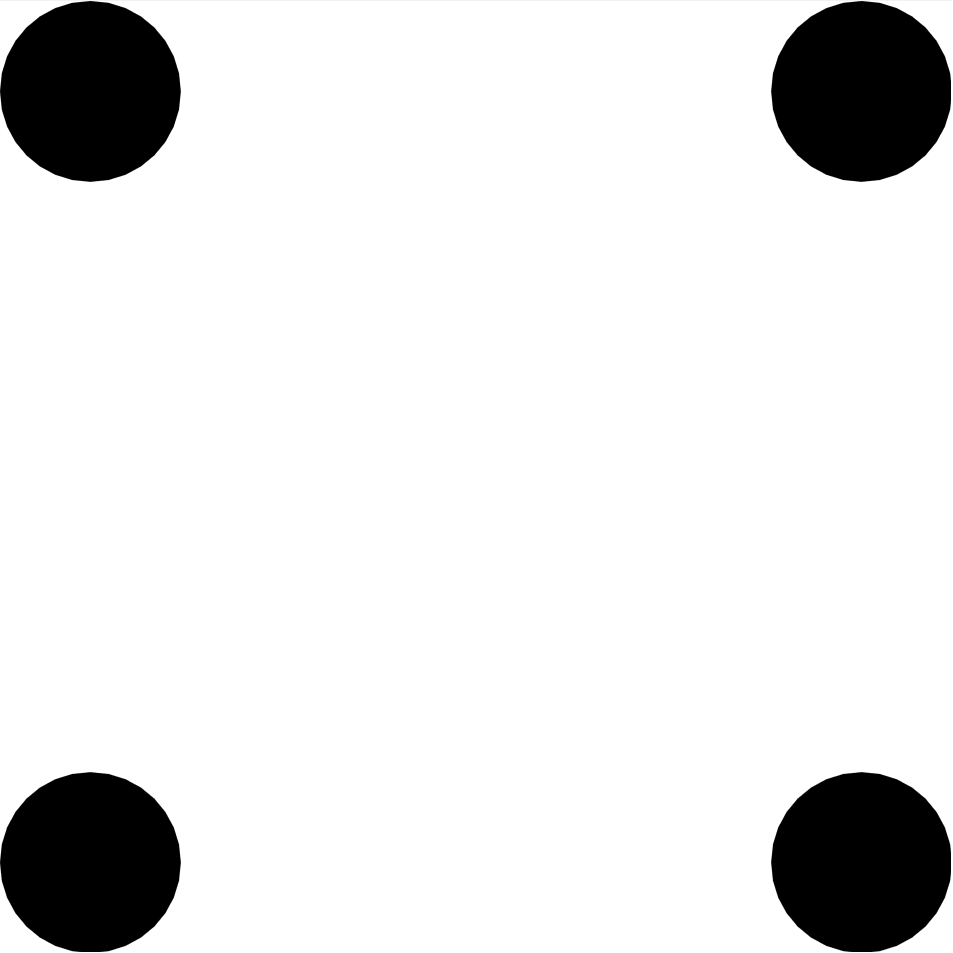 |
20 KB | Category:Squarenumbersglyph <pre>\documentclass[tikz]{standalone} \usetikzlibrary{shapes.geometric,calc} \begin{document} \begin{tikzpicture} \node (pol) [minimum size=\textwidth,regular polygon, regular polygon sides=4,color=white] at (0,0) {};... | 1 |
| 19:42, 21 June 2016 | Triangularnumber3glyph.png (file) |  |
16 KB | Category:Triangularnumbersglyph <pre>\documentclass[tikz]{standalone} \usetikzlibrary{shapes.geometric,calc} \begin{document} \begin{tikzpicture} \node (pol) [minimum size=\textwidth,regular polygon, regular polygon sides=3,color=white] at (0,0)... | 1 |
| 19:37, 21 June 2016 | Triangularnumber5glyph.png (file) | 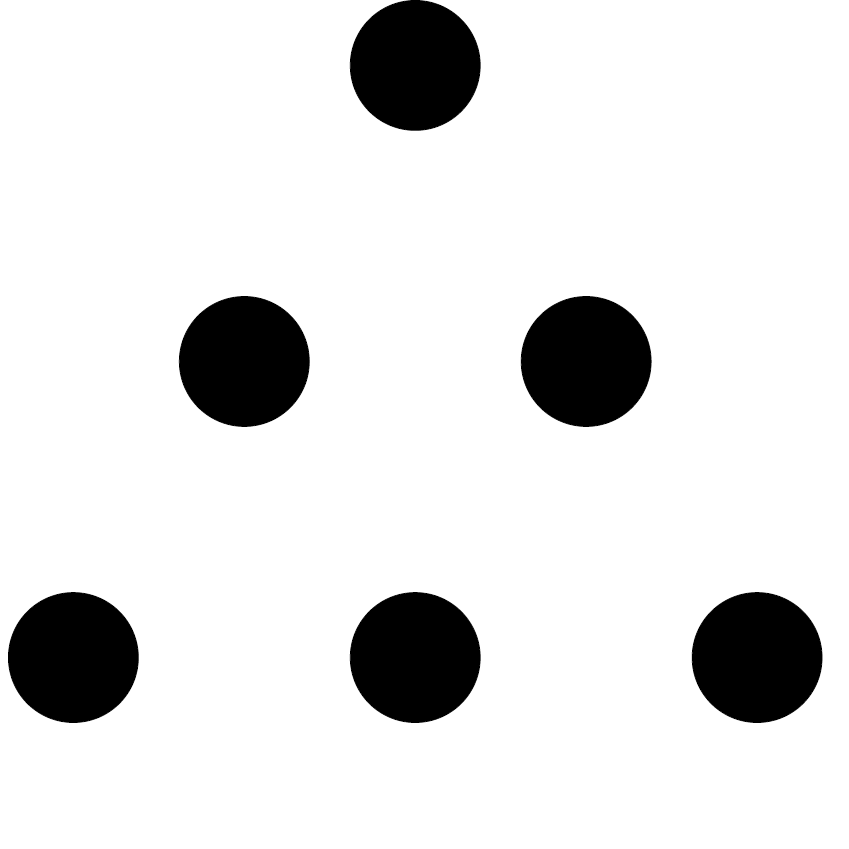 |
18 KB | Category:Triangularnumbersglyph <pre>\documentclass[tikz]{standalone} \usetikzlibrary{shapes.geometric,calc} \begin{document} \begin{tikzpicture} \node (pol) [minimum size=\textwidth,regular polygon, regular polygon sides=3,color=white] at (0,0)... | 1 |
| 23:25, 16 June 2016 | Mertensplot,n=0to2000.png (file) | 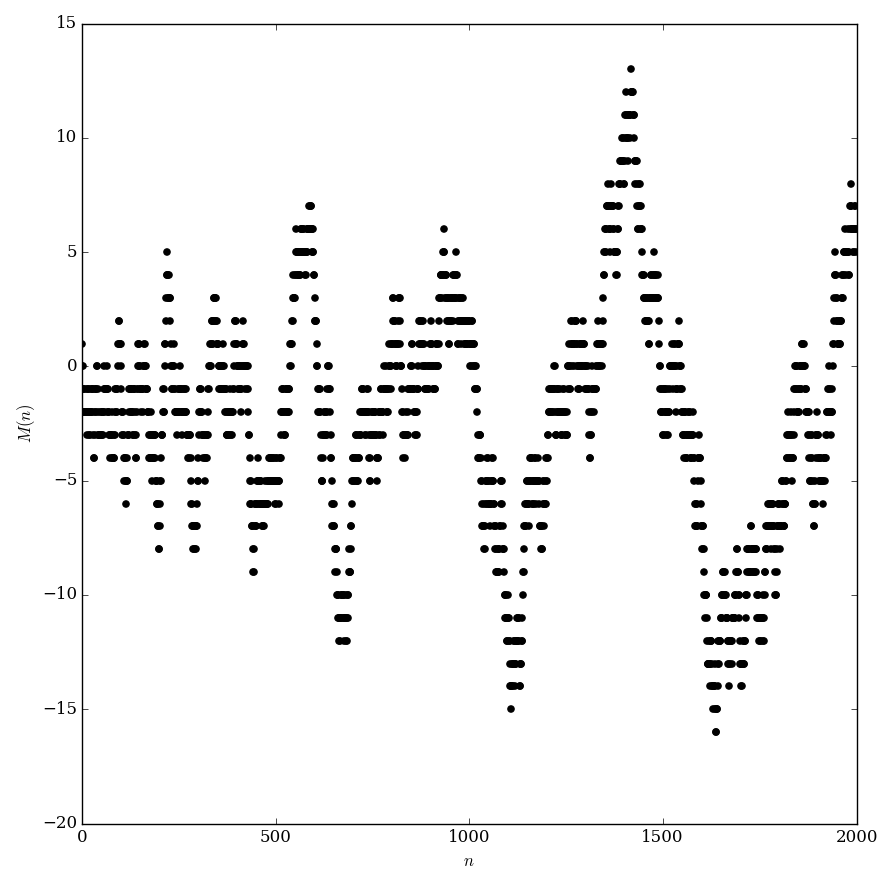 |
43 KB | Category:Plot <pre>#!/usr/bin/python import numpy as np import matplotlib.pyplot as plt from mpmath import * from pylab import rcParams rcParams['figure.figsize'] = 10, 10 def numberOfFactors(n): counter = 0 while (n > 1):... | 1 |
| 09:43, 16 June 2016 | Mobiusplot,on0to100.png (file) | 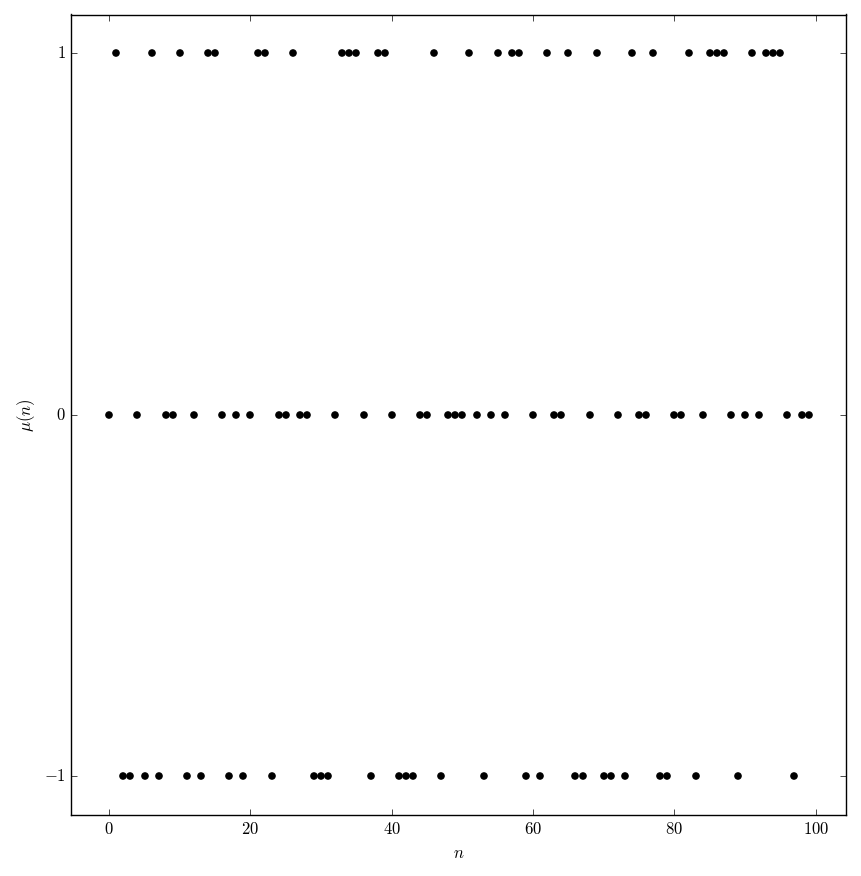 |
11 KB | Category:Plot <pre>#!/usr/bin/python import numpy as np import matplotlib.pyplot as plt from mpmath import * from pylab import rcParams rcParams['figure.figsize'] = 10, 10 def numberOfFactors(n): counter = 0 while (n > 1):... | 1 |
| 09:42, 16 June 2016 | Mobiusplot,on0to40.png (file) | 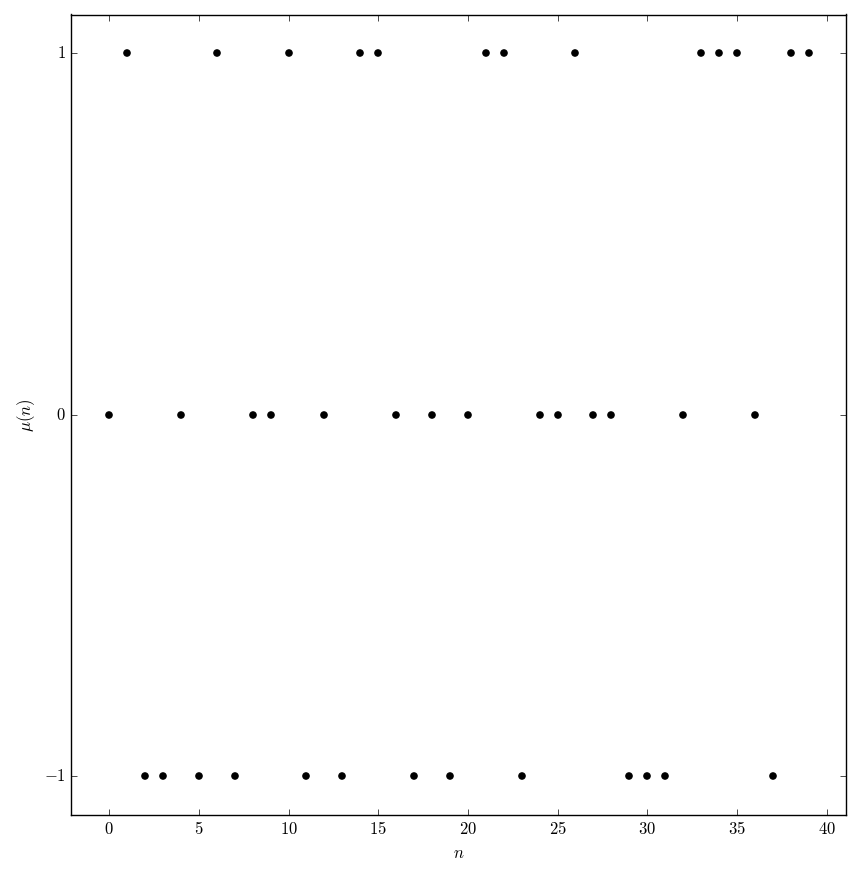 |
11 KB | Category:Plot | 1 |
| 09:20, 16 June 2016 | Complexidentityglyph.png (file) |  |
19 KB | Category:Identityglyph <pre>#!/usr/bin/python import numpy as np import matplotlib.pyplot as plt from mpmath import * from pylab import rcParams rcParams['figure.figsize'] = 2.5, 2.5 def g(x): return x cplot(g ,[-1,1],[-1,1],points=400000,... | 1 |
| 08:25, 16 June 2016 | Identityglyph.png (file) |  |
3 KB | Category:identityglyph <pre>#!/usr/bin/python import numpy as np import matplotlib.pyplot as plt from mpmath import * from pylab import rcParams rcParams['figure.figsize'] = 2.4,2.4 x=np.arange(-3,3,0.01) def g(x): return x f=np.vectorize... | 1 |
| 08:21, 16 June 2016 | Floorglyph.png (file) | 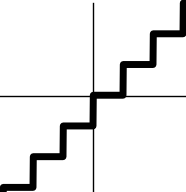 |
2 KB | Category:floorglyph <pre>#!/usr/bin/python import numpy as np import matplotlib.pyplot as plt from mpmath import * from pylab import rcParams rcParams['figure.figsize'] = 2.4,2.4 x=np.arange(-4,4,0.01) f=np.vectorize(floor) y=f(x) fig, ax = plt.s... | 1 |
| 08:18, 16 June 2016 | Ceilingglyph.png (file) | 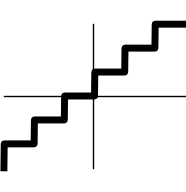 |
2 KB | Category:Ceilingglyph <pre>#!/usr/bin/python import numpy as np import matplotlib.pyplot as plt from mpmath import * from pylab import rcParams rcParams['figure.figsize'] = 2.4,2.4 x=np.arange(-3,3,0.01) f=np.vectorize(ceil) y=f(x) fig, ax = plt.... | 2 |
| 01:14, 11 June 2016 | Complexkelvinkei,n=0plot.png (file) | 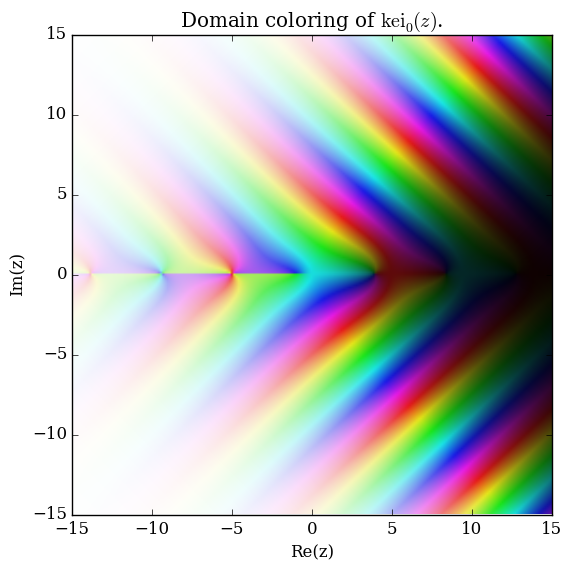 |
193 KB | Category:DomainColoring <pre>#!/usr/bin/python import numpy as np import matplotlib.pyplot as plt from mpmath import * cplot(lambda x: kei(0,x),[-15,15],[-15,15],points=50000,verbose=True) plt.title(r'Domain coloring of $\mathrm{kei}_{0}(z)$.') pl... | 1 |
| 01:07, 11 June 2016 | Complexkelvinker,n=0plot.png (file) | 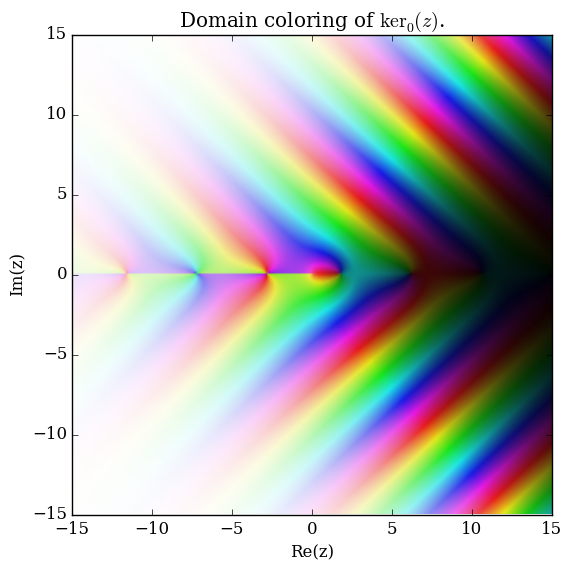 |
195 KB | Category:DomainColoring <pre> #!/usr/bin/python import numpy as np import matplotlib.pyplot as plt from mpmath import * cplot(lambda x: ker(0,x),[-15,15],[-15,15],points=50000,verbose=True) plt.title(r'Domain coloring of $\mathrm{ker}_{0}(z)$.') p... | 1 |
| 00:55, 11 June 2016 | Complexkelvinbei,n=1plot.png (file) | 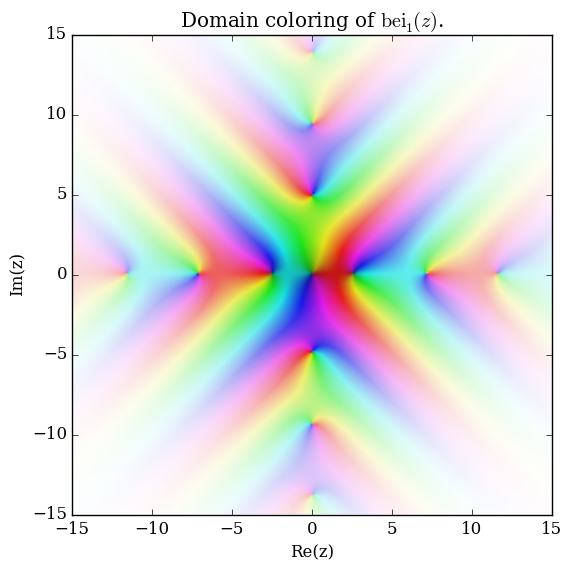 |
180 KB | Category:DomainColoring <pre>#!/usr/bin/python import numpy as np import matplotlib.pyplot as plt from mpmath import * cplot(lambda x: bei(1,x),[-15,15],[-15,15],points=50000,verbose=True) plt.title(r'Domain coloring of $\mathrm{bei}_{1}(z)$.') pl... | 1 |
| 00:51, 11 June 2016 | Complexkelvinbei,n=0plot.png (file) | 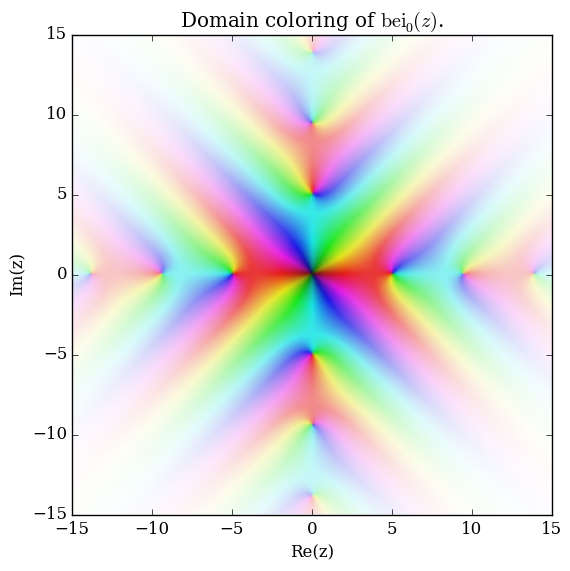 |
179 KB | Category:DomainColoring <pre>#!/usr/bin/python import numpy as np import matplotlib.pyplot as plt from mpmath import * cplot(lambda x: bei(0,x),[-15,15],[-15,15],points=50000,verbose=True) plt.title(r'Domain coloring of $\mathrm{bei}_{0}(z)$.') pl... | 1 |
| 00:37, 11 June 2016 | Complexkelvinber,n=1plot.png (file) | 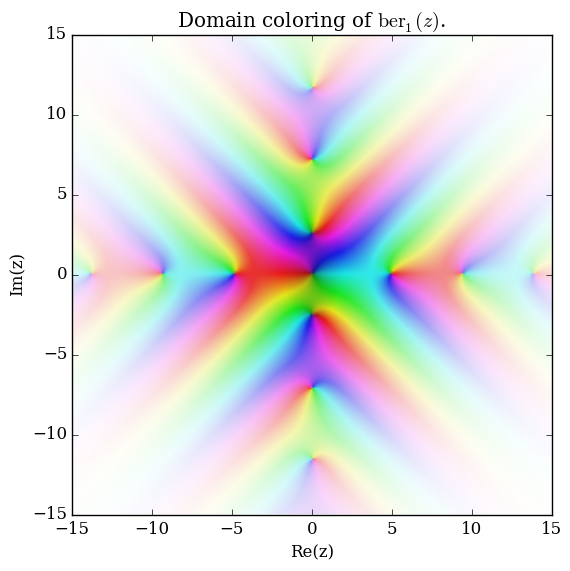 |
180 KB | Category:DomainColoring <pre>#!/usr/bin/python import numpy as np import matplotlib.pyplot as plt from mpmath import * cplot(lambda x: ber(1,x),[-15,15],[-15,15],points=50000,verbose=True) plt.title(r'Domain coloring of $\mathrm{ber}_1(z)$.') plt.... | 1 |
| 00:35, 11 June 2016 | Complexkelvinber,n=0plot.png (file) | 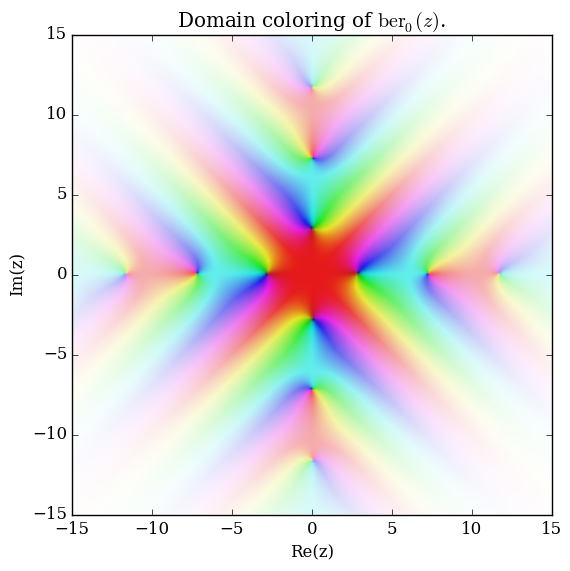 |
178 KB | Category:DomainColoring <pre>#!/usr/bin/python import numpy as np import matplotlib.pyplot as plt from mpmath import * cplot(lambda x: ber(0,x),[-15,15],[-15,15],points=50000,verbose=True) plt.title(r'Domain coloring of $\mathrm{ber}_0(z)$.') plt.... | 1 |
| 00:31, 11 June 2016 | Kelvinbei,n=1plot.png (file) | 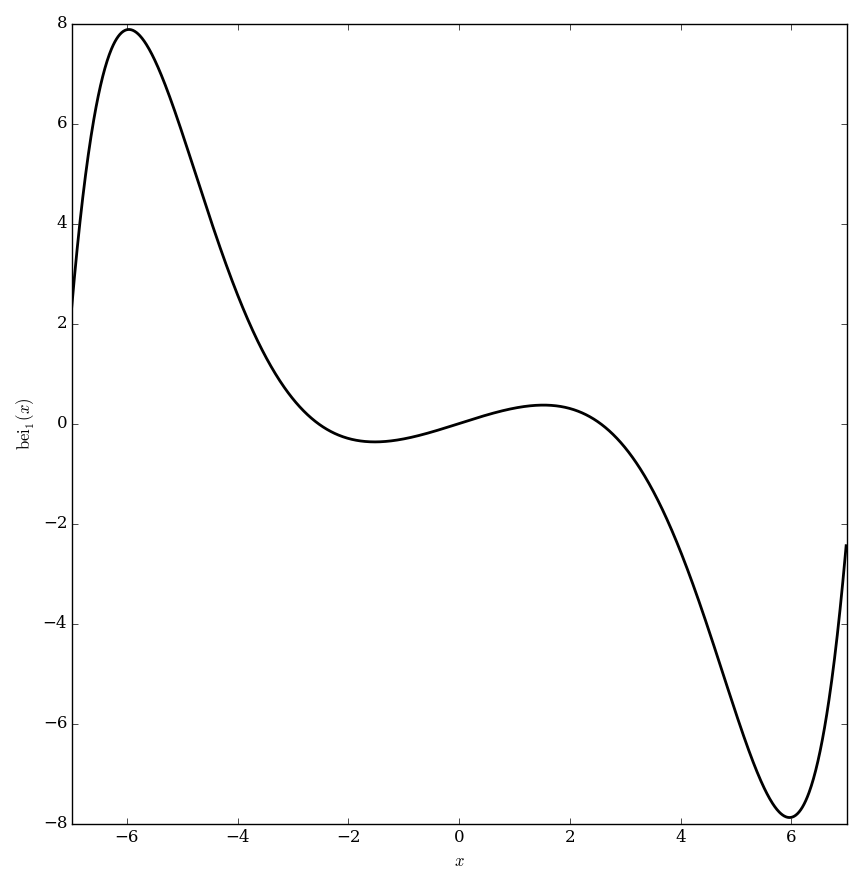 |
35 KB | Category:Plot <pre>#!/usr/bin/python import numpy as np import matplotlib.pyplot as plt from mpmath import * from pylab import rcParams rcParams['figure.figsize'] = 10, 10 x=np.arange(-7,7,0.01); f=np.vectorize(lambda x: bei(1,x)) y=f(x) fig, ax... | 1 |
| 00:27, 11 June 2016 | Kelvinbei,n=0plot.png (file) | 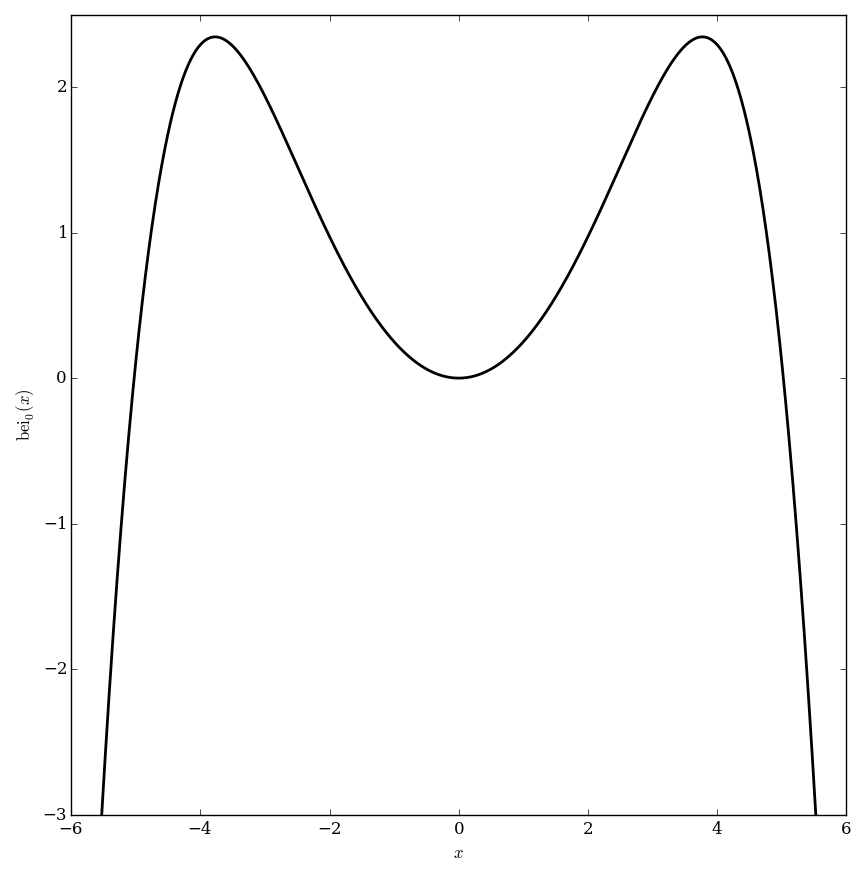 |
37 KB | Category:Plot <pre>#!/usr/bin/python import numpy as np import matplotlib.pyplot as plt from mpmath import * from pylab import rcParams rcParams['figure.figsize'] = 10, 10 x=np.arange(-6,6,0.01); f=np.vectorize(lambda x: bei(0,x)) y=f(x) fig, ax... | 1 |
| 00:24, 11 June 2016 | Kelvinber,n=0.5plot.png (file) | 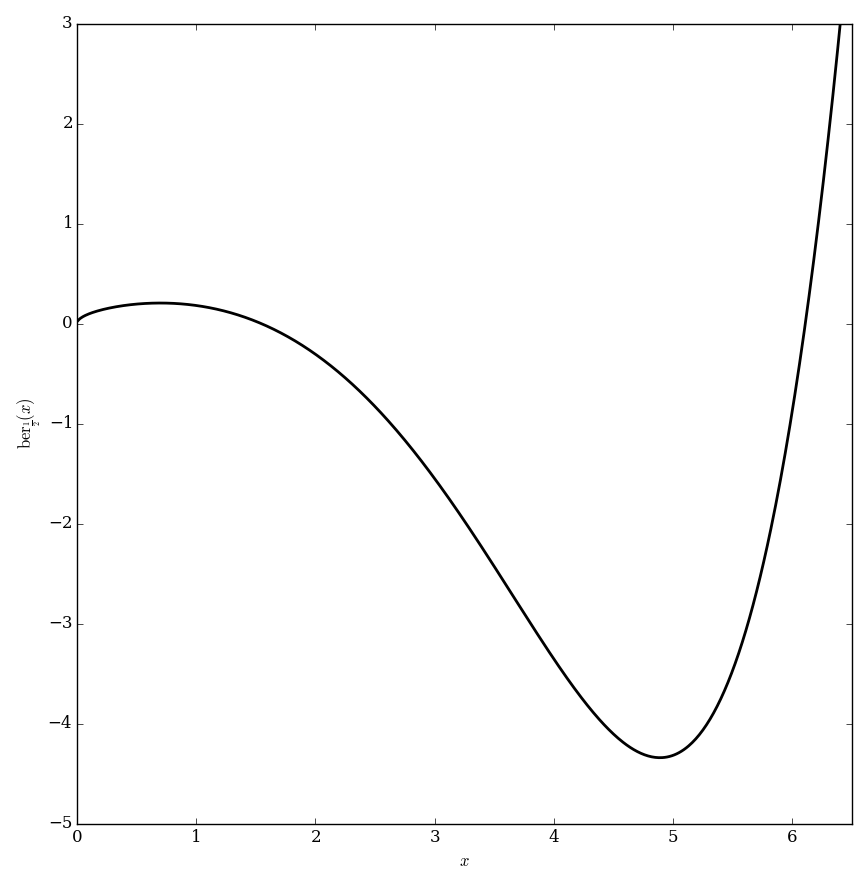 |
33 KB | Category:Plot <pre>#!/usr/bin/python import numpy as np import matplotlib.pyplot as plt from mpmath import * from pylab import rcParams rcParams['figure.figsize'] = 10, 10 x=np.arange(0.01,8,0.01); f=np.vectorize(lambda x: ber(0.5,x)) y=f(x) fig,... | 1 |
| 00:21, 11 June 2016 | Kelvinber,n=2plot.png (file) | 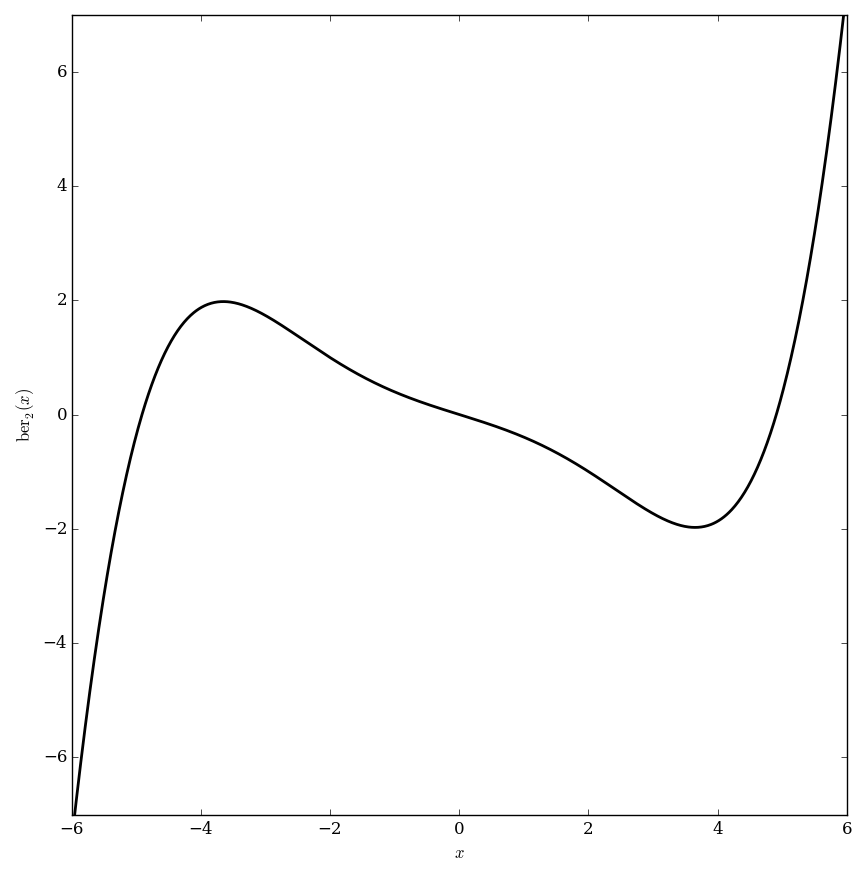 |
32 KB | Category:Plot <pre>#!/usr/bin/python import numpy as np import matplotlib.pyplot as plt from mpmath import * from pylab import rcParams rcParams['figure.figsize'] = 10, 10 x=np.arange(-8,8,0.01); f=np.vectorize(lambda x: ber(1,x)) y=f(x) fig, ax... | 1 |
| 00:18, 11 June 2016 | Kelvinber,n=1plot.png (file) | 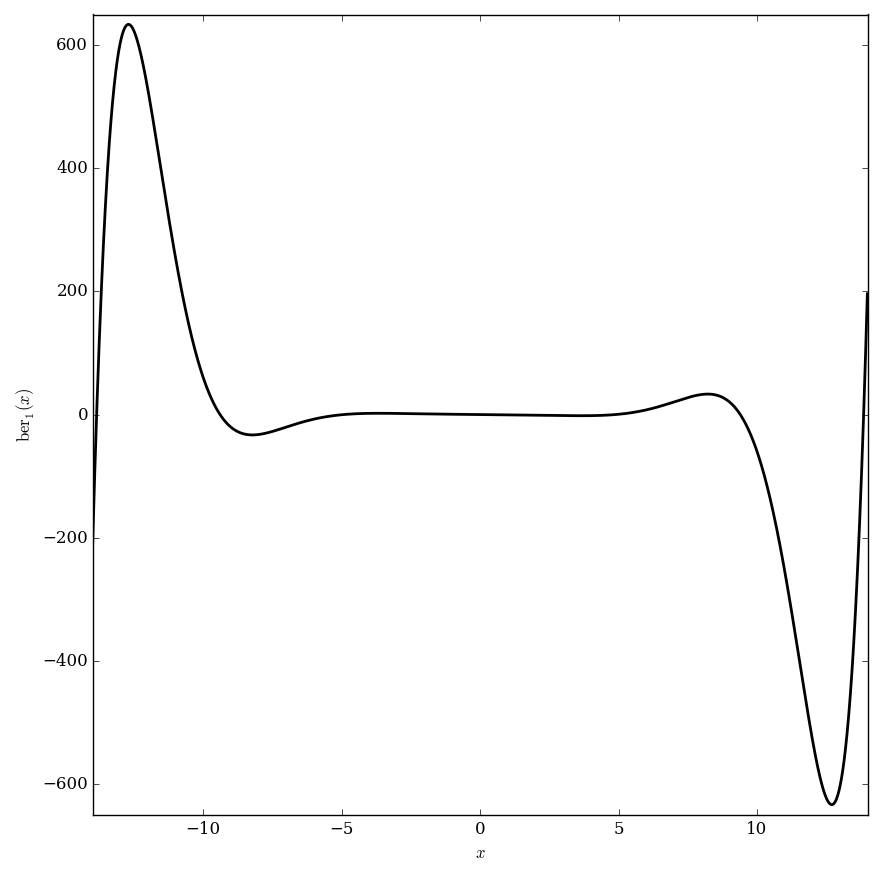 |
33 KB | Category:Plot <pre>#!/usr/bin/python import numpy as np import matplotlib.pyplot as plt from mpmath import * from pylab import rcParams rcParams['figure.figsize'] = 10, 10 x=np.arange(-14,14,0.01); f=np.vectorize(lambda x: ber(1,x)) y=f(x) fig, a... | 1 |
| 00:15, 11 June 2016 | Kelvinber,n=0plot.png (file) | 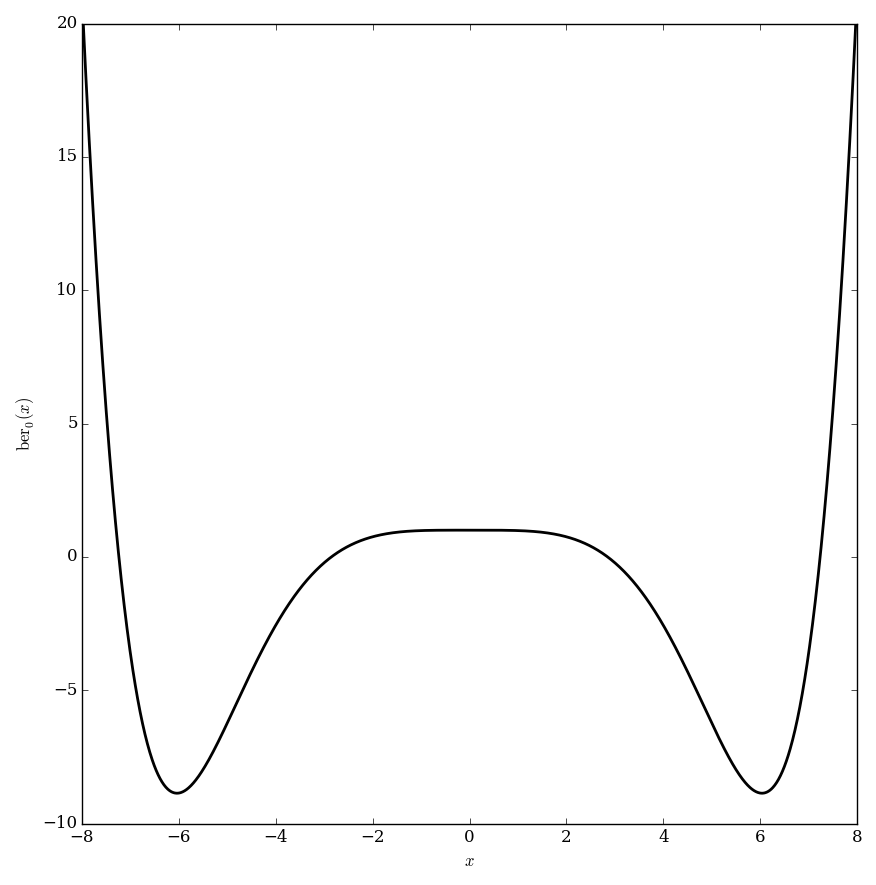 |
35 KB | Category:Plot <pre>#!/usr/bin/python import numpy as np import matplotlib.pyplot as plt from mpmath import * from pylab import rcParams rcParams['figure.figsize'] = 10, 10 x=np.arange(-8,8,0.01); f=np.vectorize(lambda x: ber(0,x)) y=f(x) fig, ax... | 1 |
| 23:52, 10 June 2016 | Besseli,n=1plot.png (file) | 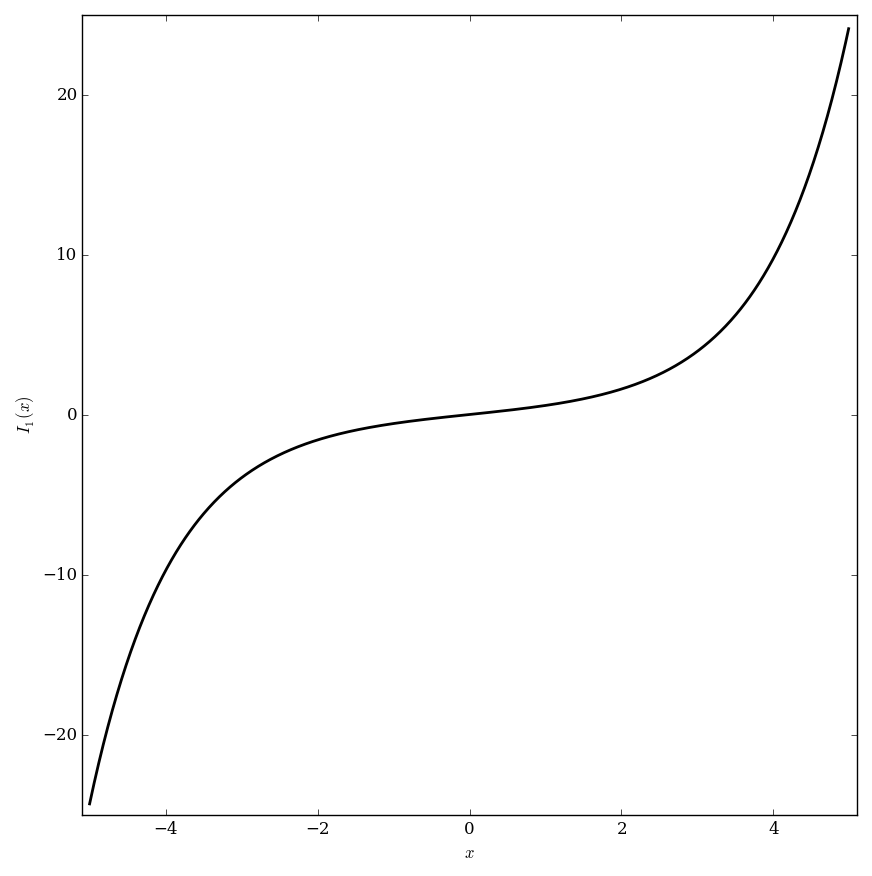 |
27 KB | Category:Plot <pre>#!/usr/bin/python import numpy as np import matplotlib.pyplot as plt from mpmath import * from pylab import rcParams rcParams['figure.figsize'] = 10, 10 x=np.arange(-5,5,0.01); f=np.vectorize(lambda x: besseli(1,x)) y=f(x) fig... | 1 |
| 23:51, 10 June 2016 | Besseli,n=0plot.png (file) | 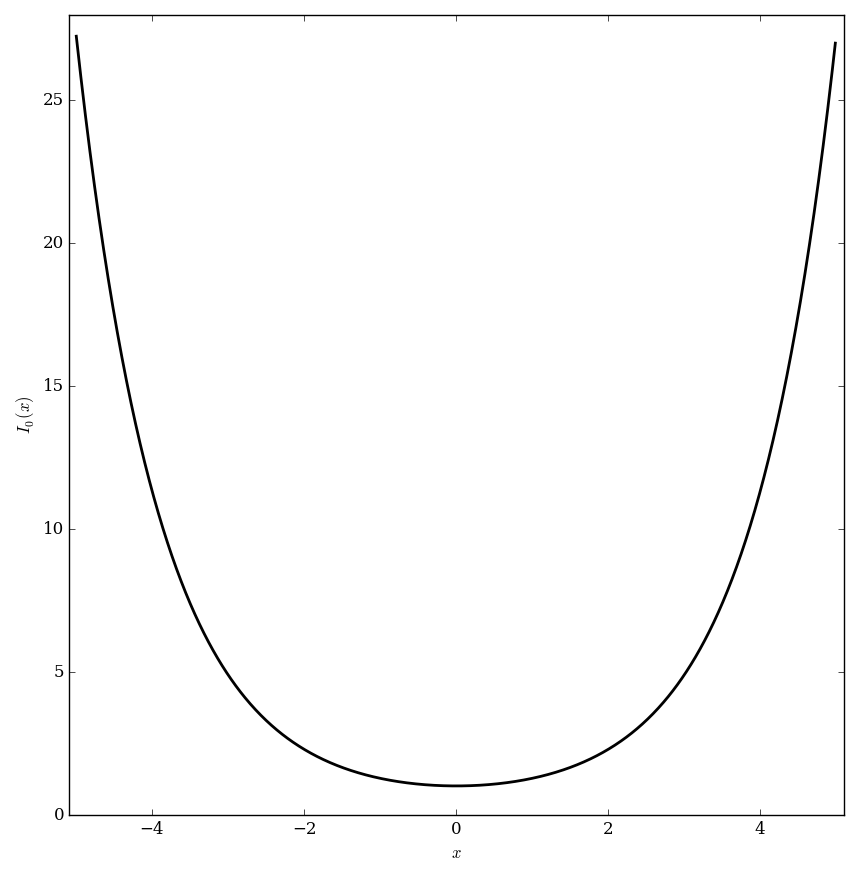 |
32 KB | Category:Plot <pre>#!/usr/bin/python import numpy as np import matplotlib.pyplot as plt from mpmath import * from pylab import rcParams rcParams['figure.figsize'] = 10, 10 x=np.arange(-5,5,0.01); f=np.vectorize(lambda x: besseli(0,x)) y=f(x) fig... | 1 |
| 23:45, 10 June 2016 | Besselk,n=0plot.png (file) | 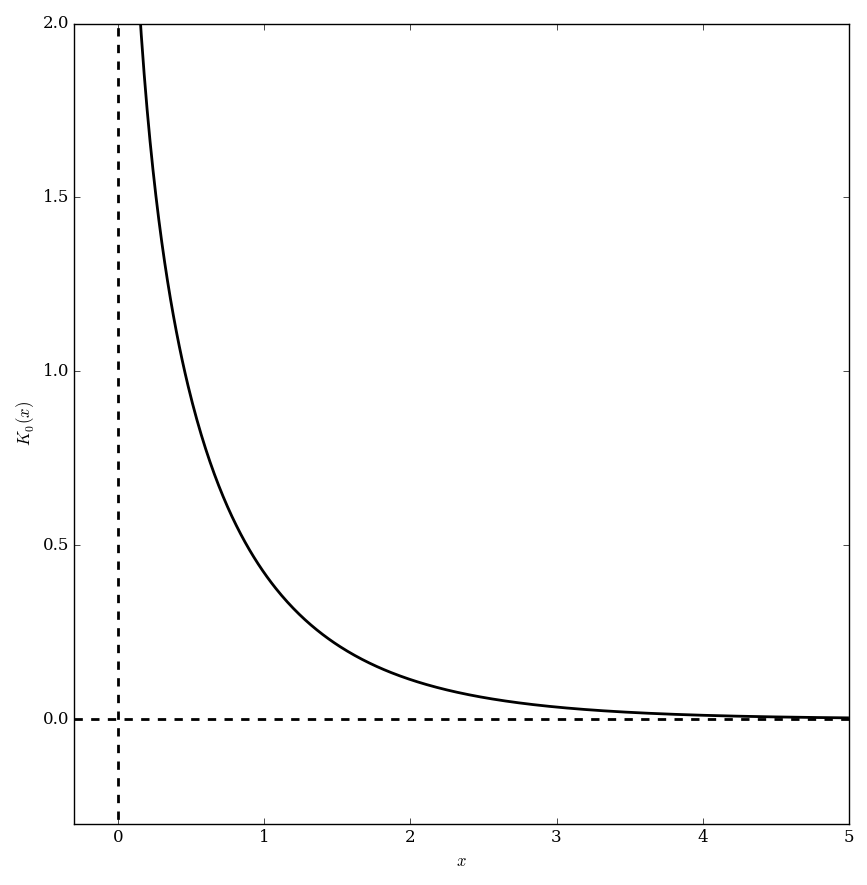 |
27 KB | Category:Plot <pre>#!/usr/bin/python import numpy as np import matplotlib.pyplot as plt from mpmath import * from pylab import rcParams rcParams['figure.figsize'] = 10, 10 x=np.arange(0.01,5,0.01); x2=np.arange(-15,15,0.1); j0=np.vectorize(lambda... | 1 |
| 23:43, 10 June 2016 | Multiplebesselkplot.png (file) | 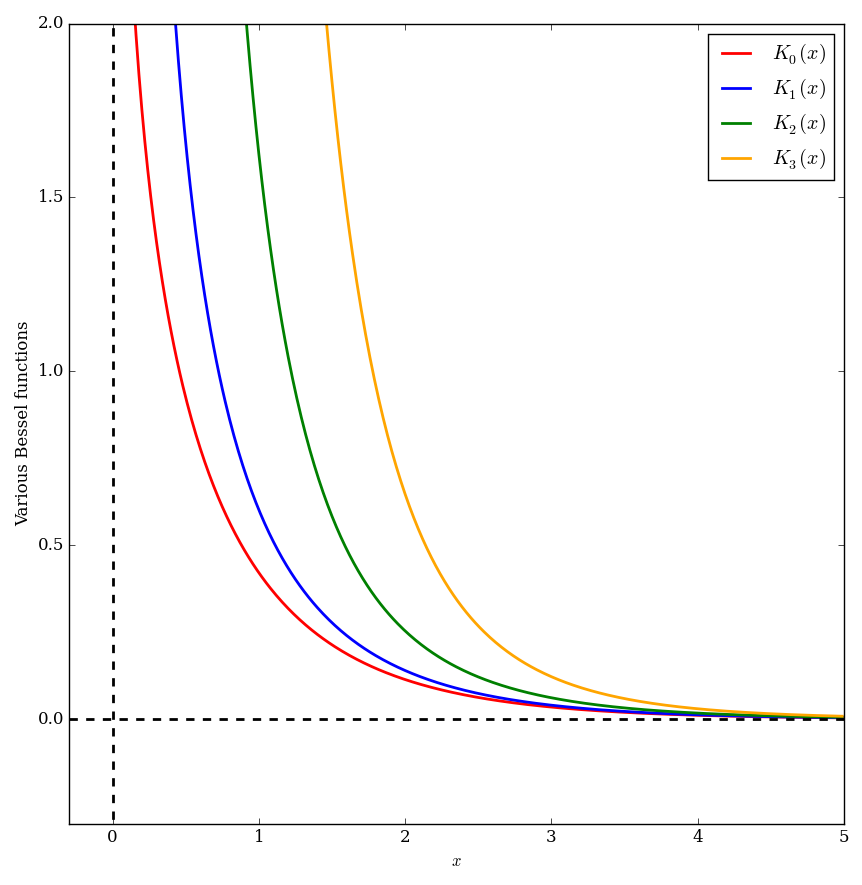 |
62 KB | Category:Plot <pre>#!/usr/bin/python import numpy as np import matplotlib.pyplot as plt from mpmath import * from pylab import rcParams rcParams['figure.figsize'] = 10, 10 x=np.arange(0.01,5,0.01); x2=np.arange(-15,15,0.1); j0=np.vectorize(lambda... | 2 |
| 23:33, 10 June 2016 | Multiplebesseliplot.png (file) | 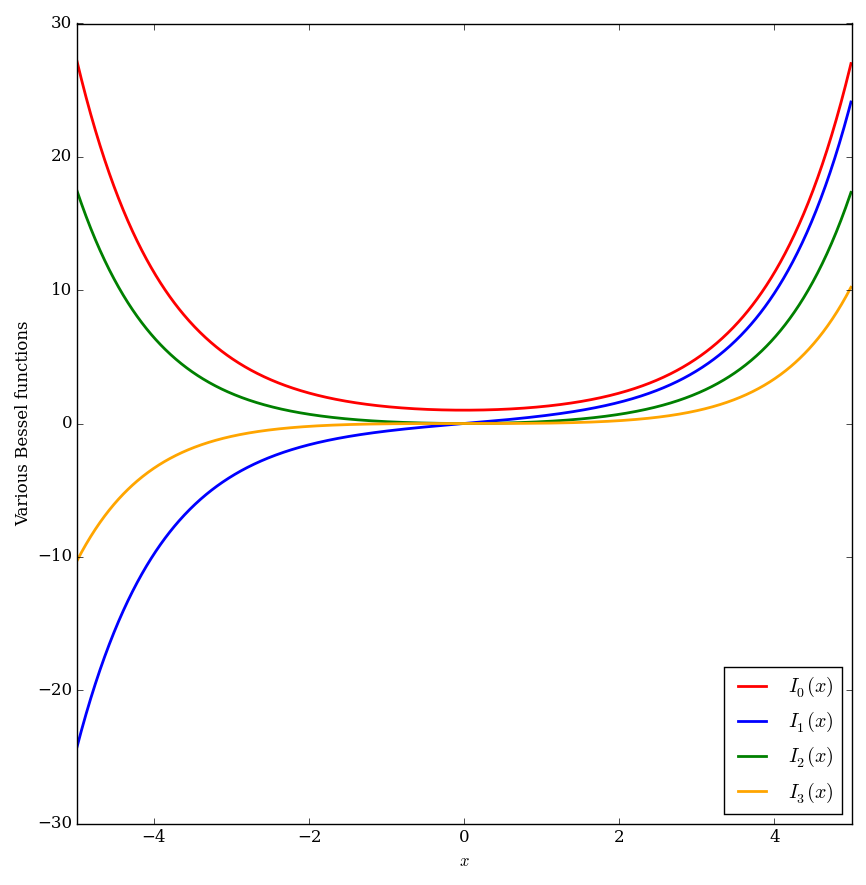 |
61 KB | Category:Plot <pre>#!/usr/bin/python import numpy as np import matplotlib.pyplot as plt from mpmath import * from pylab import rcParams rcParams['figure.figsize'] = 10, 10 x=np.arange(-5,5,0.01); j0=np.vectorize(lambda x: besseli(0,x)) j1=np.vecto... | 1 |
| 23:24, 10 June 2016 | Complexbesseli,n=1plot.png (file) | 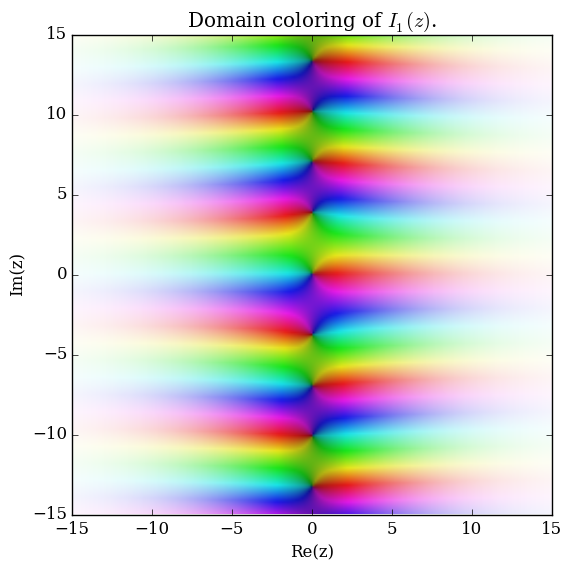 |
117 KB | Category:DomainColoring <pre>#!/usr/bin/python import numpy as np import matplotlib.pyplot as plt from mpmath import * cplot(lambda x: besseli(1,x),[-15,15],[-15,15],points=50000,verbose=True) plt.title(r'Domain coloring of $I_1(z)$.') plt.savefig... | 1 |
| 23:22, 10 June 2016 | Complexbesseli,n=0plot.png (file) | 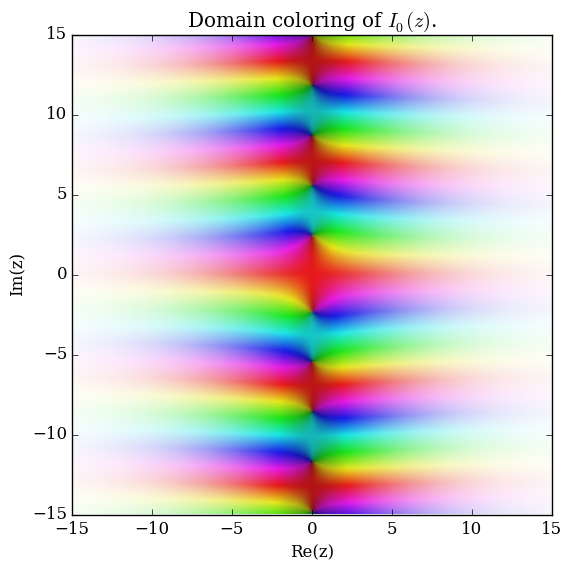 |
119 KB | Category:DomainColoring <pre>#!/usr/bin/python import numpy as np import matplotlib.pyplot as plt from mpmath import * cplot(lambda x: besseli(0,x),[-15,15],[-15,15],points=50000,verbose=True) plt.title(r'Domain coloring of $I_0(z)$.') plt.savefig... | 1 |
| 23:13, 10 June 2016 | Sphericalbessely,n=0glyph.png (file) |  |
7 KB | Category:Sphericalbessely <pre>#!/usr/bin/python import numpy as np import matplotlib.pyplot as plt from mpmath import * from pylab import rcParams rcParams['figure.figsize'] = 2.4,2.4 def sphericalbessely(n,z): return ((pi/(2*z))**(1/2))*... | 1 |
| 22:59, 10 June 2016 | Sphericalbesselj,n=0glyph.png (file) |  |
7 KB | Category:Sphericalbesseljglyph <pre>#!/usr/bin/python import numpy as np import matplotlib.pyplot as plt from mpmath import * from pylab import rcParams rcParams['figure.figsize'] = 2.4,2.4 def sphericalbesselj(n,z): return ((pi/(2*z))**(1... | 1 |
| 22:47, 10 June 2016 | Complexsphericalbessely,n=0glyph.png (file) |  |
26 KB | Category:Sphericalbesselyglyph <pre>#!/usr/bin/python import numpy as np import matplotlib.pyplot as plt from mpmath import * from pylab import rcParams rcParams['figure.figsize'] = 2.5, 2.5 def sphericalbessely(n,z): return ((pi/(2*z))**... | 1 |
| 22:42, 10 June 2016 | Complexsphericalbesselj,n=0glyph.png (file) |  |
24 KB | Category:Sphericalbesseljglyph <pre>#!/usr/bin/python import numpy as np import matplotlib.pyplot as plt from mpmath import * from pylab import rcParams rcParams['figure.figsize'] = 2.5, 2.5 def sphericalbesselj(n,z): return ((pi/(2*z))**... | 1 |
| 22:36, 10 June 2016 | Complexbesseli,n=0glyph.png (file) |  |
24 KB | Category:Besseliglyph <pre>#!/usr/bin/python import numpy as np import matplotlib.pyplot as plt from mpmath import * from pylab import rcParams rcParams['figure.figsize'] = 2.5, 2.5 cplot(lambda x: besseli(0,x),[-8,8],[-8,8],points=40000,verbose=... | 1 |
| 22:34, 10 June 2016 | Complexbesselk,n=0glyph.png (file) |  |
19 KB | Category:Besselkglyph <pre>#!/usr/bin/python import numpy as np import matplotlib.pyplot as plt from mpmath import * from pylab import rcParams rcParams['figure.figsize'] = 2.5, 2.5 cplot(lambda x: besselk(0,x),[-8,8],[-8,8],points=40000,verbose=... | 1 |
| 22:23, 10 June 2016 | Complexbessely,n=0glyph.png (file) |  |
26 KB | Category:Besselyglyph <pre>#!/usr/bin/python import numpy as np import matplotlib.pyplot as plt from mpmath import * from pylab import rcParams rcParams['figure.figsize'] = 2.5, 2.5 cplot(lambda x: bessely(0,x),[-8,8],[-8,8],points=40000,verbose=... | 1 |
| 22:20, 10 June 2016 | Complexbesselj,n=0glyph.png (file) |  |
24 KB | Category:Besseljglyph <pre>#!/usr/bin/python import numpy as np import matplotlib.pyplot as plt from mpmath import * from pylab import rcParams rcParams['figure.figsize'] = 2.5, 2.5 cplot(lambda x: besselj(0,x),[-8,8],[-8,8],points=40000,verbose=... | 1 |
| 22:12, 10 June 2016 | Besselk,n=0glyph.png (file) | 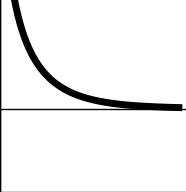 |
3 KB | Category:Besselkglyph <pre>#!/usr/bin/python import numpy as np import matplotlib.pyplot as plt from mpmath import * from pylab import rcParams rcParams['figure.figsize'] = 2.4,2.4 x=np.arange(0.1,4,0.01) x2=np.arange(-25,25,0.1) f=np.vectorize(l... | 2 |
| 21:31, 10 June 2016 | Besseli,n=1glyph.png (file) | 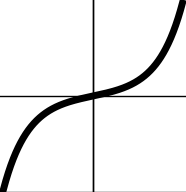 |
5 KB | Category:Besseliglyph <pre>#!/usr/bin/python import numpy as np import matplotlib.pyplot as plt from mpmath import * from pylab import rcParams rcParams['figure.figsize'] = 2.4,2.4 x=np.arange(-4,4,0.01) x2=np.arange(-25,25,0.1) f=np.vectorize(la... | 1 |
| 21:26, 10 June 2016 | Besseli,n=0glyph.png (file) | 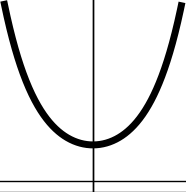 |
6 KB | Category:Besseliglyph <pre>#!/usr/bin/python import numpy as np import matplotlib.pyplot as plt from mpmath import * from pylab import rcParams rcParams['figure.figsize'] = 2.4,2.4 x=np.arange(-3,3,0.01) x2=np.arange(-25,25,0.1) f=np.vectorize(la... | 3 |
| 21:20, 10 June 2016 | Bessely,n=1glyph.png (file) | 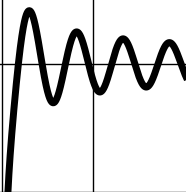 |
7 KB | Category:Besselyglyph <pre>#!/usr/bin/python import numpy as np import matplotlib.pyplot as plt from mpmath import * from pylab import rcParams rcParams['figure.figsize'] = 2.4,2.4 x=np.arange(0.1,25,0.01) x2=np.arange(-25,25,0.1) f=np.vectorize(... | 1 |
First page |
Previous page |
Next page |
Last page |