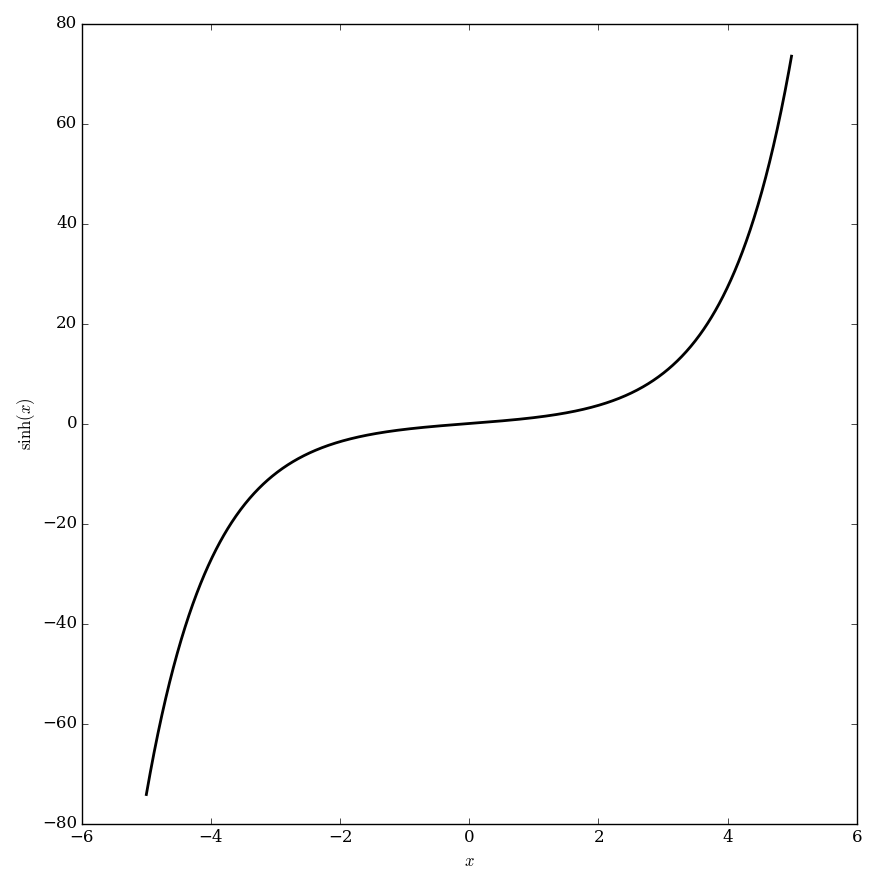
File:Sinhplot.png
From specialfunctionswiki
Size of this preview: 593 × 600 pixels. Other resolutions: 237 × 240 pixels | 875 × 885 pixels.
Original file (875 × 885 pixels, file size: 29 KB, MIME type: image/png)
File history
Click on a date/time to view the file as it appeared at that time.
| Date/Time | Thumbnail | Dimensions | User | Comment | |
|---|---|---|---|---|---|
| current | 06:48, 9 June 2016 | | 875 × 885 (29 KB) | Tom (talk | contribs) | Category:Plot <pre>#!/usr/bin/python import numpy as np import matplotlib.pyplot as plt from mpmath import * from pylab import rcParams rcParams['figure.figsize'] = 10, 10 x=np.arange(-5,5,0.01); f=np.vectorize(sinh) y=f(x) fig, ax = plt.subplots... |
| 09:38, 9 November 2015 | 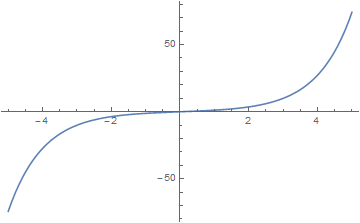 | 360 × 223 (5 KB) | Tom (talk | contribs) |
- You cannot overwrite this file.
File usage
The following page links to this file: