File:Tangentplot.png
From specialfunctionswiki
Revision as of 03:16, 8 February 2016 by Tom (talk | contribs) (Category:Plot <pre>#!/usr/bin/python import numpy as np import matplotlib.pyplot as plt from mpmath import * from pylab import rcParams rcParams['figure.figsize'] = 10, 10 x=np.arange(-2*pi+0.0001,2*pi-0.001,0.00001); f=np.vectorize(tan) y=f(x) f...)
Size of this preview: 590 × 600 pixels. Other resolutions: 236 × 240 pixels | 861 × 875 pixels.
Original file (861 × 875 pixels, file size: 37 KB, MIME type: image/png)
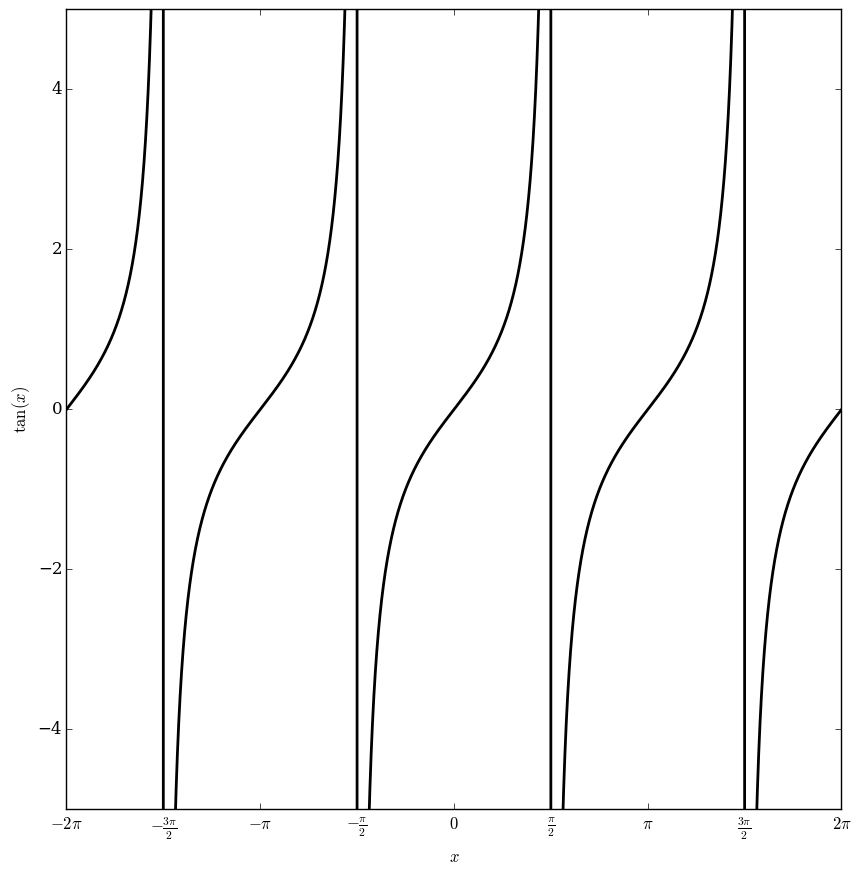
#!/usr/bin/python
import numpy as np
import matplotlib.pyplot as plt
from mpmath import *
from pylab import rcParams
rcParams['figure.figsize'] = 10, 10

x=np.arange(-2*pi+0.0001,2*pi-0.001,0.00001);
f=np.vectorize(tan)
y=f(x)

fig, ax = plt.subplots()


xlabels = [item.get_text() for item in ax.get_xticklabels()]
xlabels=[r'$-2\pi$',r'$-\frac{3\pi}{2}$',r'$-\pi$',r'$-\frac{\pi}{2}$','$0$',r'$\frac{\pi}{2}$',r'$\pi$',r'$\frac{3\pi}{2}$',r'$2\pi$']
ax.set_xticks([-6.283185,-4.712388980,-3.1415926,-1.57079632,0.0,1.57079632,3.1415926,4.712388980,6.283185])
ax.set_xticklabels(xlabels,horizontalalignment='center')

plt.ylim([-5,5])

plt.xlabel('$x$')
plt.ylabel(r'$\tan(x)$')

plt.plot(x,y,linewidth=2,color='Black')

plt.savefig('tangentplot.png',bbox_inches='tight',pad_inches=0.1)
File history
Click on a date/time to view the file as it appeared at that time.
| Date/Time | Thumbnail | Dimensions | User | Comment | |
|---|---|---|---|---|---|
| current | 03:16, 8 February 2016 | | 861 × 875 (37 KB) | Tom (talk | contribs) | Category:Plot <pre>#!/usr/bin/python import numpy as np import matplotlib.pyplot as plt from mpmath import * from pylab import rcParams rcParams['figure.figsize'] = 10, 10 x=np.arange(-2*pi+0.0001,2*pi-0.001,0.00001); f=np.vectorize(tan) y=f(x) f... |
- You cannot overwrite this file.
File usage
The following page links to this file: